Lesson 4: Inferential statistics and regression modeling

1 Overview

Lesson 4: Inferential Statistics and Regression Modeling
< Lesson 3 |  
In this lesson we will briefly cover a few main concepts used in inferential statistics, such as estimating a population parameter, hypothesis testing, Analysis of Variance (ANOVA), and Chi square tests.

After completing this section you should be able to do the following:

bulletrecognize common inferential statistical tests
bulletidentify and compute basic point estimates of population parameters
bulletdescribe the basics of hypothesis testing
bulletidentify some common tests used in hypothesis testing
bulletunderstand and identify the use of regression modeling
 
LESSON 4
< Lesson 3 |  

2 Inferential Statistics

Lesson 4: Inferential Statistics and Regression Modeling
Inferential statistics are used to draw inferences about a population from a sample.
Example

For instance consider an experiment where tree growth rates were increased by 25 percent following a forest thinning operation on 10 sites compared to tree growth rates on 10 sites which were not thinned. Inferential statistics allows us to decide if the increased growth rates are due to chance or are real.

There are primarily two ways to use inferential statistics:

  1. The first is to estimate a parameter about a population.
  2. The second is to test a hypothesis.

For the example above, the hypothesis would be forest thinning has no effect on tree growth rates. This type of hypothesis is often called the null hypothesis, and is the first step in conducting a hypothesis test. Another way we could use inferential statistics is to simply predict or estimate what the average effect of the thinning was on tree growth.

LESSON 4

3 Estimating or Predicting Population Parameters

Lesson 4: Inferential Statistics and Regression Modeling
Parameters
The estimate or prediction of a population parameter is often referred to as a point estimate. That is to say, the estimate is a single value based on a sample, a statistic, which is then used to estimate the corresponding value in the population, a parameter.

The average (mean) of our sample can be used as an estimator of the population mean. We could have chosen to use the median or mode to estimate the population mean as well. However, for the remainder of this section we will deal with estimating the mean of a population only.

LESSON 4

4 Using a confidence interval

Lesson 4: Inferential Statistics and Regression Modeling
to estimate the population mean
In general terms, a confidence interval is a range of numbers which are calculated so that the true populations mean lies within this range with a particular degree of certainty.

The certainty in which a population mean lies within the range is typically expressed as 95% confidence interval, or a 99% confidence interval. As you add more certainty the width of the interval will increase.

You should remember that a confidence interval is not interpreted as a probability. That is to say a 95% confidence interval should not be interpreted by saying there is a 95% probability that the true population mean lies within the calculated range. The true interpretation of a confidence interval is that 95% of confidence intervals calculated from this population will contain the true population mean.

LESSON 4

5 Hypothesis Testing

Lesson 4: Inferential Statistics and Regression Modeling
The second type of inferential statistics we discussed earlier was hypothesis testing. This is sometimes called statistical testing as well. In point estimation and in constructing a confidence interval we had no expectations about the values we calculated, where as in hypothesis testing we have formed some expectation about the population parameter.
Example

Our hypothesis is that tree mortality after a particular forest fire will be greater then 60%. In other words average tree mortality > 60%.

Once our notion of the population parameter has been developed, we can write two contradictory hypotheses. The first is the research hypothesis, which in our case is that the mean tree mortality > 60%. The second hypothesis is called the null hypothesis, and is the opposite of our research hypothesis. In our example the null hypothesis would be stated as the mean tree mortality is less than or equal to 60%.

LESSON 4

6 One and Two Tailed Tests

Lesson 4: Inferential Statistics and Regression Modeling
Our last example is a one-tailed test. In that example we were simply considering the idea that the population mean was larger then some number. So we would reject the null hypothesis if we had large values of tree mortality.

A two-tailed test is used when a research hypothesis is stated as the following:

Example

Tree mortality following fire will be equal to 60%. Where as our null hypothesis would read tree mortality following fire is not equal to 60%.

Under this scenario we could reject our research hypothesis if tree mortality was much larger then 60 or much smaller than 60.

It is important to note that the tests we have gone over so far are only concerned with comparing the mean of one group to some number. They do not consider comparing the means of two groups to each other!

LESSON 4

7 Comparing the Means of Two Populations

Lesson 4: Inferential Statistics and Regression Modeling
of Two Populations
In many situations we will want to compare two populations parameters. To compare these two populations we can compare the differences between the two sample means.
Example

Lets say we collected the abundance of grass species 1 and 2 one year after a wildfire. We have determined that the two populations had burned under the same exact conditions at the same time etc… Now lets propose that species number 1 will be in higher abundance then species number 2 one year after the fire. This is our research hypothesis. Therefore our null hypothesis will be that there will be no difference in abundance of species 1 and 2

Once we have established our research and null hypothesis we run a test statistic for a given level (assigned as the alpha level). From this point, we can either reject our null hypothesis or not, and then draw any conclusions from the test.

Often times a t-test is used to compare the difference between two means.

Additional Information

t-tests and other statistical analysis

LESSON 4

8 ANOVA or Analysis of Variance

Lesson 4: Inferential Statistics and Regression Modeling
So far we have discussed comparing the means of two populations to each other and comparing the population mean to another number. However, we often want to compare many populations to each other.
Example

We may want to compare regeneration rates for three different tree species in northern Idaho. We would begin by taking samples from each population and then calculate the means from the three samples and make an inference about the population means from this.

It is common since that these three mean regeneration rates would all be different numbers however, this does not mean that there is a difference between the population means for the three tree types.

To answer that question we can use a statistical test called an analysis of variance or ANOVA. This test is widely used in natural resources, and you are bound to come across it when reading scientific literature.

The use of an ANOVA implies the following:

  1. all the populations are normally distributed (follow a bell shaped curve)
  2. all the population variances are equal,
  3. and all the samples were taken independently of each other and are randomly collected from their population

Generally, our null hypothesis when conducting an ANOVA is that all the population means are equal and our research hypothesis will be that at least one of the population means is not equal.

Although an ANOVA is widely used and it does indicate that a population mean is different than others, it does not tell us which one is different from the others.

Additional Information

Conducting an Analysis of Variance

LESSON 4

9 Multiple Comparison Procedures

Lesson 4: Inferential Statistics and Regression Modeling
As we already discussed an analysis of variance does provide information regarding one of a population’s means being different, but it does not tell us which one. There are many different types of multiple comparison procedures. We will list a few of the common multiple comparison procedures, but we will not cover their uses and limitations.

The following is a list of commonly used multiple comparison procedures:

  1. Tukey’s Procedure
  2. Student-Newman-Keuls procedure
  3. Dunnett’s procedure
  4. Scheffe’s Method

Remember: These tests are only used after we have rejected the null hypothesis using an ANOVA.

Additional Information

Multiple Comparison Procedures

LESSON 4

10 Regression Models and Correlation

Lesson 4: Inferential Statistics and Regression Modeling
  | Lessons >
The use of regression models is very common, and serves a very specific point to us as managers. Regression models allow us to predict the outcome of one variable from another variable.
Example

We can use a regression model to predict the mortality of a ponderosa pine tree based on the amount of crown scorch.

Regression models are very common and you have all probably seen them used in the scientific literature. Often times regressions models are associated with a scatter plot, as shown below.


Figure 1. Shows the relationship between tree height and tree age for species X

We will now add a simple linear regression equation to our example and calculate the correlation of determination (R2):
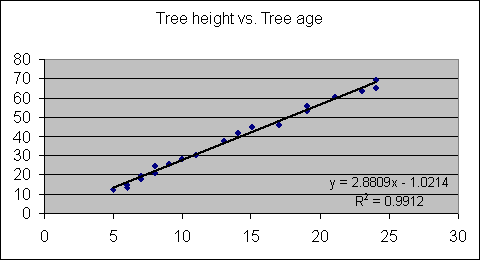
You'll notice on the figure we have identified the statistical equation which describes the line of best fit and the correlation of determination identified as R2. Although we will not go over the details of the correlation of determination you should be aware that it is essentially a measure of the strength of the linear relationship between the two variables.

We should note that just because there appears to be a strong relationship between tree height and tree age the model does not imply that tree height depends upon tree age, in other words the model does not show a cause and effect relationship. Great care should be used when drawing conclusions based on a regression analysis.

The scatter plot above could be used to build a simple linear regression model, however we could add more factors to help us better predict the outcome, these are called multiple regression models, or we could use some other form of a model that is not linear in nature, called a non-linear regression model.

Additional Information

Regression Models

LESSON 4
| Lessons >