 Six levels of service have been defined for roadways and have been given letter designations of A through F. LOS A represents the best level of service and LOS F represents the worst. The following table lists the criteria for each LOS, based on the free-flow speed.
*See Terms and Definitions To illustrate where each LOS falls with respect to speed and flow rate, the chart below shows speed versus flow rate with corresponding levels of service A through E. LOS F lies beyond LOS E. The value of the slope of each line that separates the levels of service is the maximum density for that level of service. 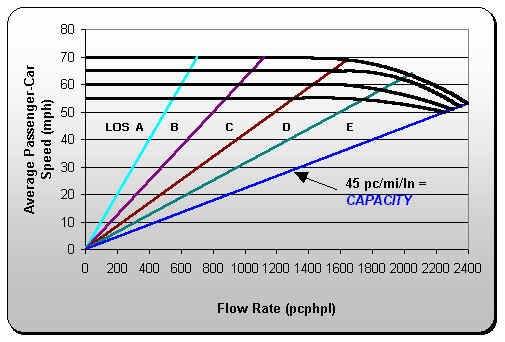
For example, the line drawn for LOS E extends from the end of the free-flow speed lines to the origin and has a slope of 45.0 pc/mi/ln. Service flow rate E is the value that corresponds to the maximum flow rate, or capacity. Service flows C or D are usually used for most design or planning purposes because these levels of service are more acceptable to roadway users. Note that the flow rate at capacity for a free-flow speed of 70 mph is 2400 pcphpl. This capacity represents ideal traffic and roadway conditions. Also note that the value of capacity varies with the free-flow speed.
|
||||||||||||||||||||||||||||||||||||||||||||||||||||||||||||||||||||||||||||||||||||||||||||||||||||||||||||||||||||||||||||||||||||||||||||||||||