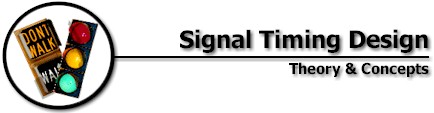
 Queuing theory provides the design engineer with a traffic flow model that can be used in the design of signalized intersections. Consider a simple situation in which traffic is arriving at an intersection approach in a uniform manner, with equal and constant headways between each vehicle. This constant flow rate is shown in the figure below. 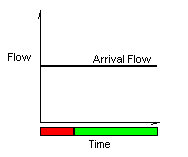 Figure 1: Constant Arrival Flow During the red interval for the approach, vehicles cannot depart from the intersection and consequently, a queue of vehicles is formed. When the signal changes to green, the vehicles depart at the saturation flow rate until the standing queue is cleared. Once the queue is cleared, the departure flow rate is equal to the arrival flow rate. Figure 2 illustrates this behavior..  Figure 2: Departure Flow or Service Flow versus Time The combined effect of the arrival and departure flow rates is illustrated by graphing queue length versus time. During the red interval, the line of vehicles waiting at the intersection begins to increase. The queue reaches its maximum length at the end of the red interval. When the signal changes to green, the queue begins to clear as vehicles depart from the intersection at the saturation flow rate. See the figure below. 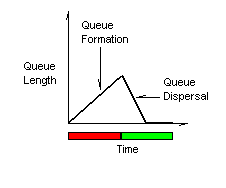 Figure 3: Queue Length versus Time There is another graph that allows us to glean even more information from our model. Imagine a plot where the x-axis is time and the y-axis contains the vehicle numbers according to the order of their arrival. Vehicle one would be the first vehicle to arrive during the red interval and would be the lowest vehicle on the y-axis. If you were to plot the arrival and departure (service) times for each vehicle, you would get a triangle as shown in figure 4 below. 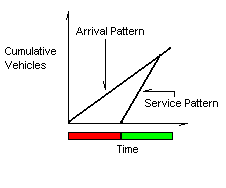 Figure 4: Vehicles versus Time While this graph may not seem informative at first, a second look reveals its insights. For a given time, the difference between the arrival pattern and the service pattern is the queue length. For a given vehicle, the difference between the service pattern and the arrival pattern is the vehicle delay. In addition, the area of the triangle is equivalent to the total delay for all of the vehicles. See figure 5 below. 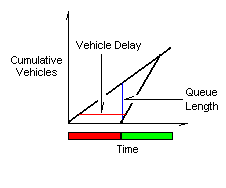 Figure 5: Graph Properties As you would expect, the first vehicle to be stopped by the red signal experiences the most delay. In addition, the queue is longest just before the green interval begins. Queuing theory provides a foundation for the optimization of signal timing.
|