Lab Exercise 1: The Gravity Model
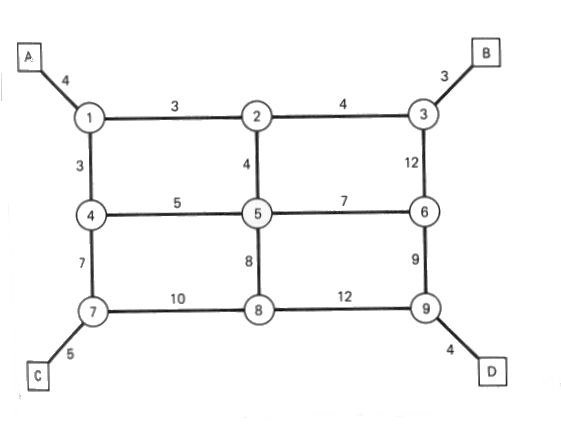
The four-zone city of Wocsom’s trip generation characteristics are shown
below, in addition to a travel network for the city. There are two major activities in
this lab assignment:
- Use the trip generation information provided to distribute the trips between the four
zones.
- Using the results of the trip distribution analysis and the results of the network
analysis, assign the trips to the various links.

The four-zone city has the following productions and attractions:
Zone |
Productions |
Attractions |
A
B
C
D |
1000
2000
3000
4000 |
3000
3000
2000
2000 |
| |
Travel Time (min) |
Zone |
A |
B |
C |
D |
A
B
C
D |
2
5
7
10 |
5
3
8
12 |
7
8
2
11 |
10
12
11
3 |
Travel Time (min) |
Fij |
2
3
5
7
8
11
12 |
3.0
2.5
2.3
1.5
1.2
0.95
0.90 |
Tasks to be Completed
Task 1: Distribute the trips for the city of Wocsom using the gravity model. Use
the given data to develop a trip table for the four-zone city of Wocsom.
Task 2: Find the shortest path from nodes A,B,C, and D to all other nodes and
intersections.
Task 3: Using the trip table (veh/hr) below, load the network and find the total
volume on each link assuming all or nothing assignment.
From\ To |
A |
B |
C |
D |
A
B
C
D |
--
30
90
60 |
50
--
80
70 |
40
80
--
50 |
20
10
20
-- |
Task 4: Using the trip table resulting from the gravity model above, load the
network and find the total volume on each link, assuming all or nothing assignment.
Task 5: Prepare a brief report documenting your analysis, and be sure to explain
the differences and similarities in the results of Task 3 and Task 4.
Assumptions
For your analysis using the gravity model, assume the socioeconomic factor Kij=1.0.
|