Cross-Classification
The three major techniques used for Trip Generation Analysis are Cross-Classification,
Multiple Regression Analysis, and Experience Based Analysis. Cross-Classification
procedures measure the changes in one variable (trips) when other variables (land use
etc.) are accounted for. Cross-Classification resembles multiple regression techniques.
Cross-Classification is essentially non-parametric, since no account is taken of the
distribution of the individual values. One problem with the Cross-Classification technique
is that the "independent" variables may not be truly independent, and the
resultant relationships and predictions may well be invalid.
The FHWA Trip Production Model uses Cross-Classification and has the following
sub-models.
- Income sub-model: reflects the distribution of households within various income
categories (e.g. high, medium and low).
- Auto ownership sub-model: relates the household income to auto ownership.
- Trip production sub-model: establishes the relationship between the trips made by each
household and the independent variables.
- Trip purpose sub-model: relates the trip purposes to income in such a manner that the
trip productions can be divided among various purposes. These models are developed using
origin-destination travel surveys.
A considerable amount of research and development has focused on the area of
disaggregate models for improved travel demand forecasting. The difference between the
aggregate and disaggregate techniques is mainly in the data efficiency. Aggregate models
are usually based upon home interview origin and destination data that has been aggregated
into zones; then the "average" zonal productions and attractions are derived.
The disaggregate approach is based on large samples of household types and travel
behaviors and uses data directly. There are savings in the amount of data required and
some of the data can be transferred to other applications. The disaggregate approach
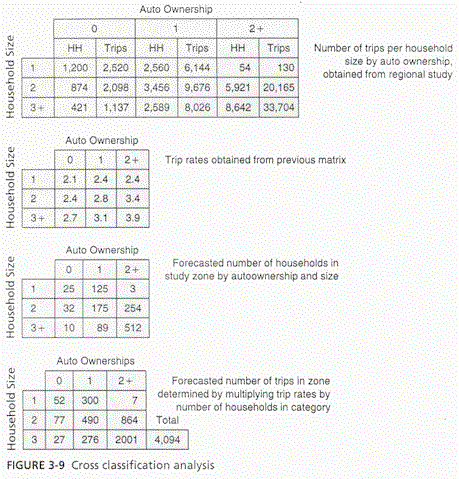
expresses non-linear relationships and is more easily understood. The tables shown below
show several steps of a cross-classification analysis.

The above figures are from: Paul Wright, Highway Engineering, 6th
ed. Wiley, 1996.pp55, 56, and 58
|