
Urban Heat Island Effect
d) Measuring the Urban Heat Island Effect

Urban heat islands occur on the surface and in the atmosphere. Therefore when measuring the UHI, they can be measured at the surface or through air temperature.
Surface Measurement
Typically surface measurement is performed through remote sensing that can identify and measure the wavelengths emitted from the surface (USEPA, 2011). All surfaces emit thermal energy in the form of wavelengths. The warmer the surface the more intense the wavelength becomes. Figure 1 illustrates how thermal wavelengths change as the temperature increases.
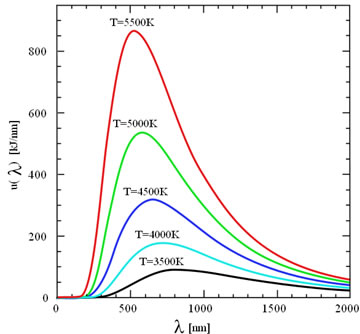 Figure 1.
(Wikimedia, 2011)
Figure 1.
(Wikimedia, 2011)
Surfaces can become super-heated on a hot summer day, increasing in temperature 50-90°F (USEPA, 2011). This significant increase in temperature can also warm ambient air temperature, especially in dense built areas with little to no vegetative surfaces. This variation in temperature can make surface UHI measurement difficult.
Remote sensing has several limitations including capturing emissions from vertical surfaces, like the side of a building wall. This is a challenge for remote sensing because the equipment is designed to capture mission from horizontal surfaces like streets, rooftops and treetops (USEPA, 2011). The sensor captures data from a birds-eye point of view which is not always the most accurate representation of the UHI. The second challenge is remotely sensed data represents radiation that has traveled through the atmosphere twice (USEPA, 2011). As the sensor receives the measurement, the wavelength has traveled from the sun to the earth, and then reflected from the earth’s surface back into the atmosphere to an orbiting or high flight sensor. To account for this error the data must be adjusted to include solar reflectance and temperature (USEPA, 2011).
Air Temperature Measurement
Air temperature is measured usually about five feet above the ground where standard weather observations are taken (USEPA, 2011). The purpose of measuring the air temperature five feet above the ground is to capture the ambient air temperature independent of the surface temperature. The correlation between surface and air temperature decreases as altitude increases, therefore using air temperature as an indicator of the thermal properties of a surface depends on the height of the measurement (USEPA, 2011). Other limitations in air measurement include:
- Data are needed from weather stations both within a city and in non-urban areas close to the city
- Researchers must consider changes in instrumentation, sampling, data recording methods, and station microclimate
- Comparisons between urban and non-urban temperature records become less valid as areas around airports become urbanized, because airports often are used as the source of "non-urban" data (USEPA, 2011).
Figure 2 is a graphic representation of how surface and air temperature differ. One key element of this Figure is the temperature variation between the surface and air temperature during the day, but at night the two are closely related. The annual mean air temperature of a city with 1 million people or more can be 1.8–5.4°F (1–3°C) warmer than its surroundings. In the evening, the difference can be as high as 22°F (12°C) (Akbari, 2005).
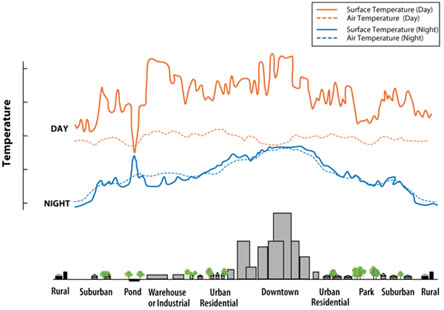 Figure 2.
(USEPA, 2011)
Figure 2.
(USEPA, 2011)
Section a) Introduction (HOME)
Section b) Why is Urban Heat Island a concern?
Section c) How Climate Change will affect UHI
Section d) Measuring the Urban Heat Island Effect
Section e) How can Urban Heat Island be Remediated? (NEXT)
Section f) Mitigation at Local/Regional/National Level
(By Kiersten Lee/Gregory Möller)
