
 Interactive: The Science of Climate Change
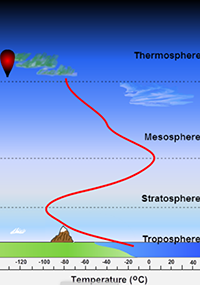
Structure of the Atmosphere
| Understanding the structure of the atmosphere is critical in understanding where and how global warming occurs. This visualization illustrates the major layers in the atmosphere and identifies a number of key characteristics and defining attributes of each layer. Run Visualization |
 |
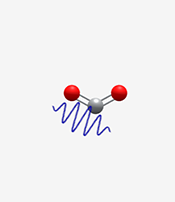
Collisional Heating by CO2 in the Atmosphere
| This animation illustrates the absorption of infrared radiation by CO2 in the troposphere and the collisional loss of this absorbed energy to surrounding N2 and O2 molecules. In this animation the user can sweep through a region of the IR spectrum and excite some of the vibrational modes of CO2. A simple (purely qualitative) thermometer illustrates the rise in temperature of the gas as collisional de-excitation occurs. Run Visualization |
 |
CFCs in the Atmosphere
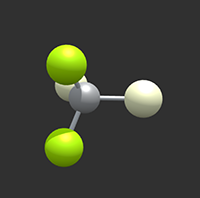 |
The behaviour of CFCs is dependent on both the wavelength of radiation as well as position of the molecule in the atmosphere. In this visualization the user can investigate the various interaction modes of a CFC molecule with electromagnetic radiation across the entire spectrum. The molecule can be rotated in 3D to better view the vibration induced by interaction with light. Run Visualization |
Infrared Spectral Windows
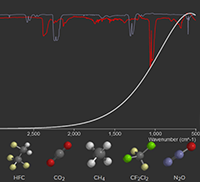 |
Greenhouse gases produce spectral features in the infrared portion of the spectrum. One area of concern is the rapidly closing "IR window" -a phenomenon which occurs because different greenhouse gases absorb in different parts of the IR window. This has potentially serious consequences for global warming. The visualization shows how the IR signatures of a number of greenhouse gases collectively "close" the window. Run Visualization |
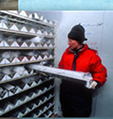
Ice-Core Analysis
| This is a visualization that introduces the user to the fascinating and complex world of ice-core analysis. Run Visualization |
 |
