|
Determining Frequency
How to calculate frequency?
As with any vegetation sampling activity, the first step is to design a
protocol that can accomplish the assessment or monitoring goal within available
time and resources. Once this is set, then frequency
measures can be accomplished by random, systematic, or subjective
locations of plots. A stratified approach might also be advantageous.
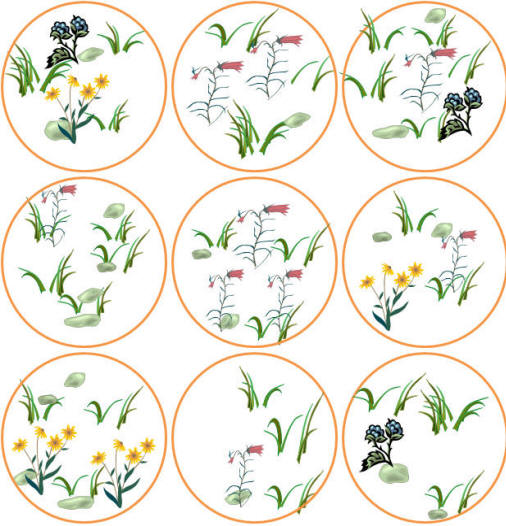
Step 1: Count and record the number of
individuals of each species in a each plot.
In the example below, 100 plots were examined.
Step 2: Calculate frequency of each
plant.
-
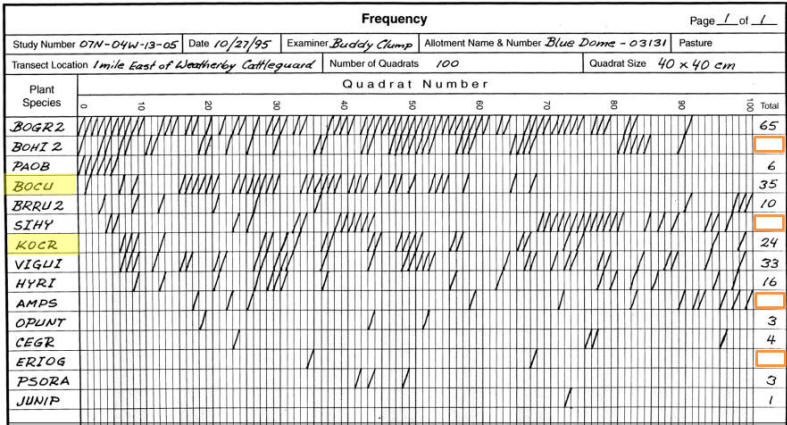
In the example data sheet above, 100 plots were examined so total number
of plots in which a plant occurred = % Frequency.
-
Two important details:
1) The number of times a plant occurs in a plot are often called "hits." In
the example above, there was 1 hit of juniper (bottom of the list).
2) Plant names are often recorded with species codes, such as in the data
sheet above. In most cases these are 4-letter codes with the first 2
letters of the genus and first 2 letters of the specific epithet.
Therefore, BOCU is Bouteloua curtipendula or sideoats grama.
KOCR = Koeleria cristata or prairie junegrass. To find the
species codes (i.e., symbol) for a plant or the name of the plant associated
with a code visit www.plants.usda.gov.
-
On the data sheet above what
is the frequency for the following plants:
Frequency of BOHI2 (Bouteloua hirsuta or Hairy grama) =
________.
Frequency of SIHI (Sitanion hystrix or Squirreltail) =
________.
Frequency of AMPS (Ambrosia psilostachya or Cuman ragweed) =
________.
Frequency of ERIOG (Eriogonum or buckwheat) =
________.
»»
Click here for answers
Is a species present or absence?
It seems obvious, but conducting a frequency assessment requires clearly
specifying what constitutes a plant species being
present in the quadrat or plot. Any of the following criteria will work as long as the
approach is documented and consistently followed:
-
Rooted Frequency - the plant of
interest must be rooted inside the sample plot in order to be counted.
-
Shoot Frequency - any runners or
shoot of a plant is rooted in the plot but the whole plant does not need to
be rooted in the plot. This is the most commonly recorded measure of
frequency.
-
Mere Presence - all plants, runners,
and shoots rooted in the plot plus overhanging leaves or shoots that lie
inside the plot boundary are counted as a hit.
Quadrat Size Matters!
If the sample plot is too small, the chances of the plant species of interest
being recorded is small, causing a low frequency. If the quadrat is too large,
the plant species of interest will be in almost all the plots. This will cause a
high frequency and will not show the plant distribution in a community.
In other words, plant frequency is completely affected by the size of the
quadrat. This effect of plot size is so profound that some ecologists,
like my colleague Dr. Stephen Bunting, don't recognized frequency as a true
plant attribute. Rather, Dr. Bunting thinks of
frequency as a joint characteristic of plant and quadrat. Thus, when
assessing frequency it is very important to select an appropriate plot size
that adequately samples each plant of interest. Yes, this will
occasionally require that several different plot sizes be used if several plant
are being examined. This problem is solved by a nested frequency plot,
discussed in the next lesson.
The appropriate quadrat size depends on
the size and density of the plant.
-
It is difficult to detect an increase in a plant's abundance if it
occurs in nearly all the plots. General rule:
If frequency is 90 to 100% for the plant
species of interest, reduce the quadrat size.
-
Likewise, it is difficult to record a decline in a species if the
initial frequency of the plant is very low.
General rule: If the plant species of
interest is not present in most of the samples taken, increase plot size.
A few more guidelines for selecting an appropriate quadrat size:
-
Plot size should be such that frequency for the important species fall
between 20% and 80%. Some researchers suggest the resulting frequency should
be between 30% and 70%.
-
Plot size may change depending on species measured. Plot size should be
1 to 2 times as large as mean area of the most common species.
-
Include maximum number of species possible. In other words, the plot
should be big enough to include as many of the species on the site as possible.
-
There is a math equation to help determine size of plot using a
logarithmic relationship between frequency and density (refer to Bohnam
1989).
-
Suggested empirical sizes from Cain and Castro 1959:
► Moss layer 0.01- 0.05 m2
► Herb layer 1-2 m2 (commonly used
units are 1 m2)
► Tall herbs and low shrubs 4 m2
► Tall shrubs and low trees 10 m2
► Trees 100 m2
|
 and
and