|
Measuring Frequency
Overcoming Quadrat Size Issues
One of the greatest shortcomings of assessing vegetation with frequency is that
this measurement is completely depended on quadrat size. Challenges with
quadrat size include:
- You can't really know until after a pilot study or after collecting data
what an appropriate size will be. You need a plot that samples a
frequency between 20% and 80%.
- Even if you select a quadrat size that works this year, the quadrat may
become too big or too small as the vegetation community changes over time.
- A quadrat that is "just" right for one plant may be too big or too small
for another species of interest. (Sounds a bit like Goldilocks searching for
the right chair).
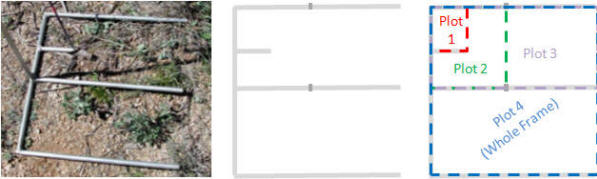
To overcome this "right size" problem, rangeland scientists, (Smith, Bunting,
and Hironaka 1986), proposed a Nested Frequency
plot where 3 plots were nested within one another.
With a nested quadrat, all plants recorded in the
smallest segment of the quadrat would automatically be known to occur in the
larger quadrat. Each new plant occurring in successively larger quadrats, in the
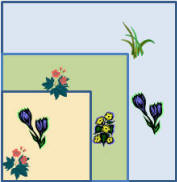
nested quadrate frame, is recorded. In the example below, the first section of
the quadrat in which a plant occurs (1 = smallest, 2= medium, 3= largest) is
recorded. When recording date with nested frequency plots, the smallest frame in
which the plant occurs is recorded.
Sample 1:
 |
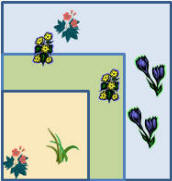
Sample 2:
 |
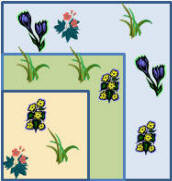
Sample 3:
 |
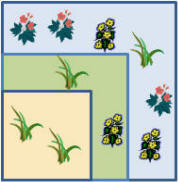
Sample 4:
 |
First
record the
smallest frame in which the plant occurs:
1 = smallest, 2= medium, 3= largest
| |
Sample 1 |
Sample 2 |
Sample 3 |
Sample 4 |
| Red Flower |
1 |
1 |
1 |
3 |
| Blue Flower |
1 |
3 |
3 |
- |
| Yellow Flower |
2 |
2 |
1 |
2 |
| Grass |
3 |
1 |
1 |
1 |
Next summarize data to examine occurrence in each plot size:
| |
Plot 1
(smallest) |
Plot 2
(medium) |
Plot 3
(largest) |
| |
Hits |
% Freq |
Hits |
% Freq |
Hits |
% Freq |
| Red Flower |
3 |
75% |
3 |
75% |
4 |
100% |
| Blue Flower |
1 |
25% |
1 |
25% |
3 |
75% |
| Yellow Flower |
1 |
25% |
4 |
100% |
4 |
100% |
| Grass |
3 |
75% |
3 |
75% |
1 |
25% |
** note, frequency count "Hits" is cumulative, if plant occur in 1 it
also occurs in 2, etc.
The % Frequency = Number of Hits ÷ Total number of plots examined.. in
this case 4 plots were examined.
Nested Frequency Method: Step-by-Step
-
Create a nested quadrat that is a series of 3 to 5 quadrats nested within each
other. A common frame size for herbaceous plants is 50 x 50cm, with four smaller
quadrat sizes nested within the frame (5x5 cm, 25x25 cm, 25x50 cm, and 50x50
cm.
-
Record all plants occurring in the smallest quadrat. Then, examine each
successively larger quadrat and record new plants that are not already
recorded as occurring in smaller quadrats.
-
Remember, presence of a plant in a smaller quadrat means that it
automatically occurs in larger quadrats.
-
Estimate Frequency for each nested quadrat (small to large) separately.
-
Look at data to see which plot size most appropriately estimates each
important species.
Recall that a good plot size would yield a frequency between 20 and 80%.
The advantage of this technique is that one does not need
to determine in advance which plot size is going to best represent each
species. You simply record occurrence in all quadrats and decide later
which is best.
Give it try -
In the following example,
Idaho Fescue (FEID) would be best
sampled with a plot size 2 or 3. Plot size 1 is too small because
frequency should be > 20% and Plot size 4 is too big because frequency
should be less than 80%. For Bottlebrush Squirreltail (SIHI), plot size
3 and 4 are the only
plots that are large enough.
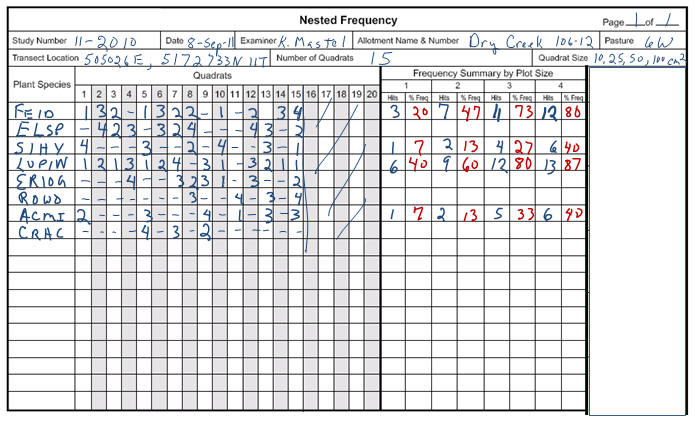
In the example data sheet above, calculate the frequency
and determine an appropriate plot size for:
►ELSP (Elymus spicatus) or
Bluebunch Wheatgrass
►ERIOG (Eriogonum) or Buckwheat
►ROWO (Rosa woodsii) or Woods Rose
►CRAC (Crepis acuminata) or Tappertip Howksbeard
► Click here for answers |
|