|
measuring cover
Basics of Plot and Quadrat Estimates
Cover methods that involve plots or quadrats are basically estimates of how
much area a plant covers in a defined area. Plot-based techniques are designed
to assess the amount of canopy cover that occurs
on a site and do not work as well for foliar or basal cover. Most
plot-based methods are specifically designed to estimate cover of
herbaceous plants and do not work well for
shrubs or trees. The following steps are required:
- Select an appropriate quadrat size. Generally, plots should be larger
than the average size of the plant of interest and larger than the average
space between plants.
- Select an appropriate quadrat size. It is generally easier to determine
% of area covered in square and rectangular plots than in circular plots.
- Place quadrats randomly or systematically along a line transect or
across a landscape with a pace-transect.
- Estimate foliar or canopy cover of plants in the quadrat.
Record estimate as % of total area.
The primary difficulty and criticism of plot-based estimates of cover is that
the are very subjective and therefore may not be consistent from observer to
observer or from year to year.
For example, estimate the canopy cover (%) of grass in the 5 plots below. How
confident are you in your estimates? If you really want to test your ability.
Ask someone you know (or even someone passing by) to estimate % cover of grass
in each plot. How much do your estimates differ from this other observer?
Categories of Cover
It can be difficult and take time to make a good estimate of how much area a
plant covers. For example, in the lower right-hand plot above (purple
quadrat), do you think there is 30, 35, or 45% grass? We could spend a lot
of time looking at the plot and arguing about the % cover. However, what if you
were aksed to categorized the grass in the plot as: 1-25%, 26-50% 51-75%, or 76-100%.
It would be easy to recognize that there is more that 25% but less than 50%
cover.
Several vegetation assessment protocols have been invented to take advantage
of the fact that it is much faster, easier, and more objective to express cover
in rather broad categories that to express it as an exact percentage. The most
common technique used on grasslands and shrublands was proposed by Rexford Daubenmire in 1959. (Daubenmire, R. 1959. A Canopy-coverage
method of vegetational analysis. Northwest Science 33:43-64). This method
is fully described in the
Sampling Vegetation Handbook
The Daubmenmire method categorized cover into 6-cover classes.
 |
The Daubenmire frame is 20 by 50 cm and marked to
facilitate categorization of vegetation into the following categories.
| Cover Class
|
Range of Cover |
Midpoint of Range |
| 1 |
0 - 5% |
2.5% |
| 2 |
5 - 25% |
15.0% |
| 3 |
25 - 50% |
37.5% |
| 4 |
50 - 75% |
62.5% |
| 5 |
75 - 95% |
85.0% |
| 6 |
95 - 100% |
97.5% |
Cover calculation for any species would be:
% cover of species of interest =
(# of plots cover class 1 * 2.5%
+ # of plots cover class 2 * 15.5%
+ # of plots cover class 3 * 37.5%
+ # of plots cover class 4 * 62.5%
+ # of plots cover class 5 * 85.0%
+ # of plots cover class 6 * 97.5%)
÷ total number of plots |
Objective and Quantitative Methods
There are a many methods that use an "eyeball" estimate of the amount of
cover in a plot. However, there are a few methods that have been used to objectively measure cover.
An old and very time consuming approached to assessing cover involved drawing
the plants on paper with a pantograph tracing device.
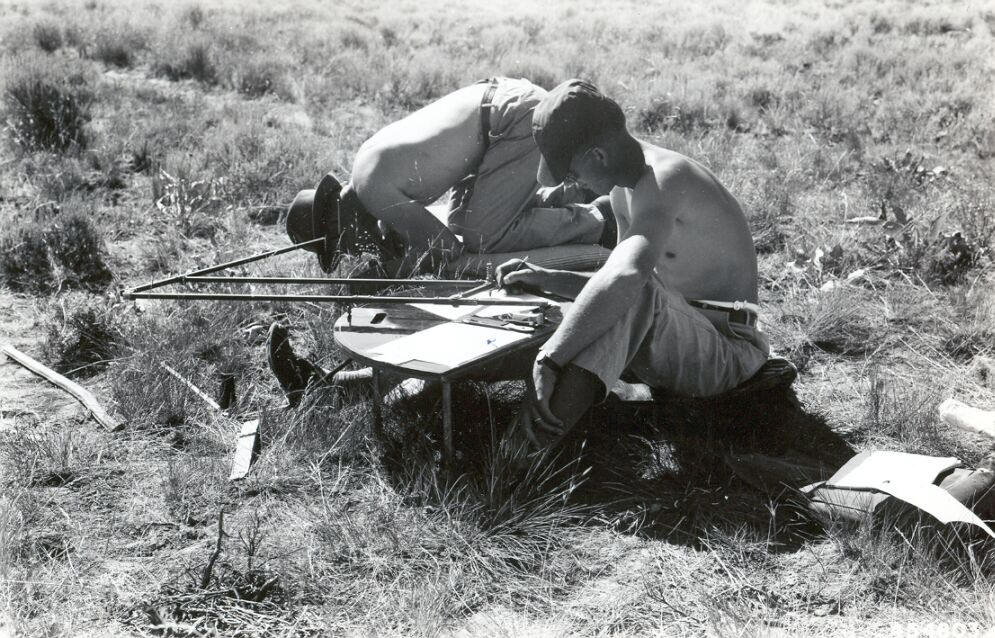 |
A pantograph was used in the field to transfer a traced image of
plant cover to paper. The paper could then be taken back to the lab to
determine the exact % cover.
<- Field technicians using a pantograph to estimate cover in 1947.
(Image from the USFS Flagstaff Lab Image Library
Great Basin Experiment Station Historic Images) |
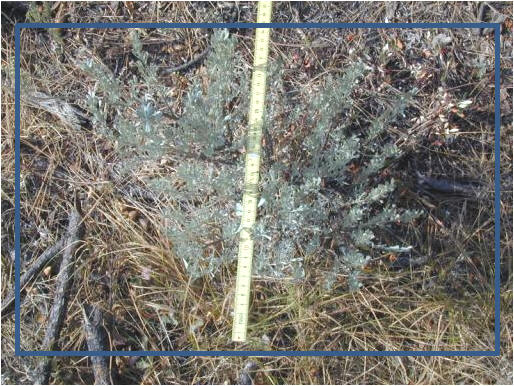
A more modern and emerging method of objectively quantifying cover
involves photographic techniques where high quality digital photographs are
taken directly above a plot. The image can then be analyzed by examining cover
attributes of points in the photo, or by conducting image analysis that
basically categorizes pixels in the image based on their color and reflectance.
This is a rapidly evolving technique that will undoubtedly become a major
tool for future vegetation assessments.
|