
B. Indices of Population Size
Represent a constant but unknown relationship between index and actual population size
Usually compare:
Populations from the same location at different times
Populations from different locations at the same time
1. Constant Proportion Indices
Expected Value of Index = Constant Proportion * Actual Population Size
![]()
or

Direct Methods - based on actual counts of animals seen, caught, heard, or harvested
Examples: fish electroshocked per kilometer of shoreline, tadpoles caught per net sweep, salamanders captured per pitfall trap, carcasses per kilometer of road, Breeding Bird Survey
Proportional change in population size = ratio of 2 indices taken in successive years
Indirect Methods - based on signs of animal presence or activity
Examples: track counts, fecal or pellet counts, counts of conspicuous features (e.g., beaver lodges, nests)
Assumption: Assumes the index and actual abundance are related via a positive, linear relationship with slope and intercept constant.
Situations when assumption may be violated:
Index becomes saturated at high population densities
Index bottoms out at low population densities
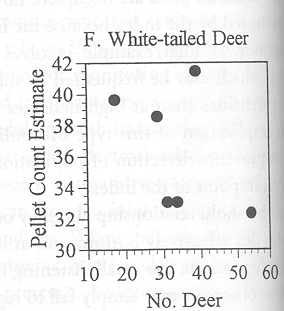
Sampling error too high (especially important for indirect indices)
Example: Pellet Counts and White-tailed deer abundance (from Boitani and Fuller 2000)

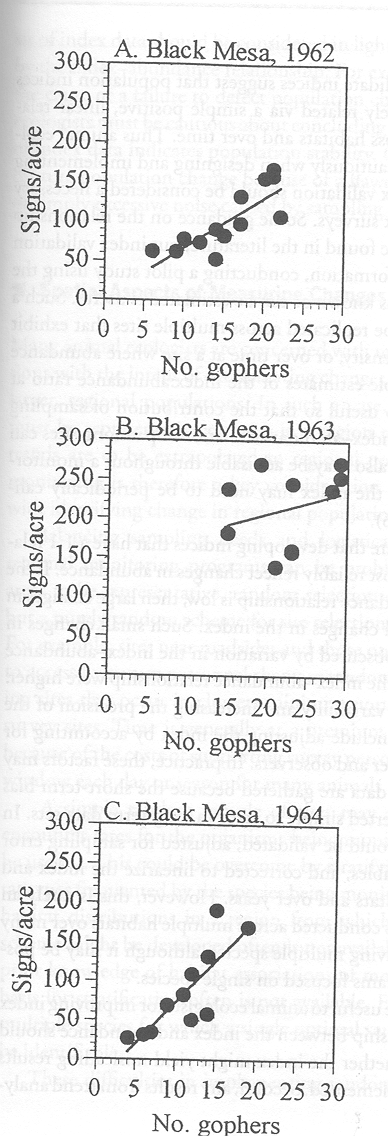
Changes in detection conditions either in space or time
Space (from Boitani and Fuller 2000)
Time (from Boitani and Fuller 2000)

2. Frequency Indices
Based on the proportion of sample units that contain at least some sign of the animal
Cannot assume constant linear relationship but assume the relationship is positive
Comparisons are thus restricted to rankings