Fall 2010

Abundance -
Density -
Population abundance estimate -
Population abundance index -
Bias -
Precision -

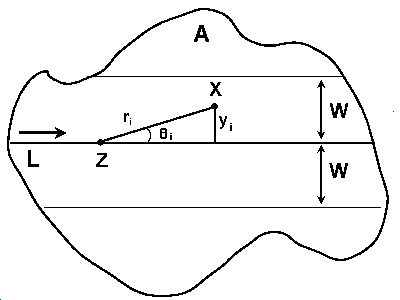
L = transect line
Z = position of observer
X = position of object
W = strip width (1/2)
ri = sighting distance (flushing distance)
0i (theta) = sighting angle
yi = perpendicular distance (note: yi = ri sin 0i )
Not all individuals will be detected
The critical assumption permitting estimation from distance data is that all objects located directly on the line (distance = 0) are detected, i.e., g(0) = 1.
Program TRANSECT performs the calculations and model fitting noted above. Because the Fourier series is a robust estimator, program TRANSECT uses this estimator as the default. However, other models and estimators can be selected and compared to determine the most appropriate model (see model-selection criteria listed below).
Program DISTANCE is a program for analyzing data from distance-sampling methods, including line transect and point counts. Program DISTANCE is more powerful and flexible than program TRANSECT. Consequently, we will use program DISTANCE for the in-class exercise and problem set.
Other programs: SIZETRAN, TRANSAN, LINETRAN, HAYNE
Objects directly on the line will never be missed, i.e., g(0) = 1.
Points are fixed at the initial sighting position (i.e., no movement before or after).
Distance and angles are measured exactly.
Sightings are independent events.
For clustered populations, the probability of sighting a cluster (e.g., flock, covey, etc.) is independent of cluster size.
Proper estimation of density via line transect sampling schemes involves a mix of basic statistical-sampling theory and biological knowledge of the population under study. Ten important points to consider in designing a survey were suggested:
The center line of the transect(s) must be straight and well marked. The observer must be able to determine the position of the line at all times. In some cases, a series of straight line segments will suffice.
Care must be taken to assure that objects on the center line of the transect are seen with probability equal to one. In practice, this often can be met if the observer walks carefully along the center of the line transect at all times.
Width of the transect should be treated as quite large, or effectively unbounded. Outlier data can be deleted, if necessary, during the analysis.
All measurements of distances and angles must be accurate. Use a steel tape or other appropriate device to assure a high degree of accuracy. Careless measurements and rounding errors lead to poor estimates of density and sampling variances.
All three basic measurements should be taken: right-angle distance (perpendicular distance), sighting distance (flushing distance), and sighting angle (flushing angle). Note: sighting distance and sighting angle are the measurements most commonly recorded in wildlife studies because the observer does not have to move from the original sighting position to obtain these data (and thus is less likely to "flush" additional animals during the measurement process). However, guideline #4 still applies.
Measurements should be recorded separately for each segment of the total transect length.
As a practical minimum, studies should be designed to assure that at least 40 objects are seen (n > 40), and it might be preferable if the length (L) were sufficient to allow the location of at least 60-80 objects (n > 60-80 best).
A pre-survey is recommended to aid in planning the survey design. Often, a simple visit to the area to be surveyed, along with basic biological information about the animal and its habits and habitat, will be sufficient to design an adequate survey to estimate density.
Attention should be given in designing the survey to assure that the population to be surveyed is not correlated with the sample line transects. For example, avoid transects running along roads, ridgetops, and streambottoms.
The survey should be conducted using competent, interested, and trained personnel. This point is particularly important concerning points 1,2 and 4 above.
Ungrouped versus grouped data (a priori or a posteriori). Note: program DISTANCE provides frequency histograms to help evaluate the potential for a posteriori grouping of data.
Choosing the appropriate sampling unit: individuals versus social groups (clusters) such as coveys or flocks.
Examining the data for possible outliers. You can remove outliers by specifying a truncation distance. Note: as a general rule of thumb, do not truncate >3% of the data points.
Use of replicate transect lines. It is very desirable to have some form of replicate lines (to get a more accurate estimate of variance) but this requires an adequate sample size for each line.
Selecting the appropriate model/estimator for your data.
Anderson, D. R., J. L. Laake, B. R. Crain, and K. P. Burnham. 1979. Guidelines for line transect sampling of biological populations. Journal of Wildlife Management 43:70-78.
Buckland, S. T., D. R. Anderson, K. P. Burnham, and J. L. Laake. 1993. Distance sampling: estimating abundance of biological populations. Chapman and Hall, London.
Burnham, K. P., D. R. Anderson, and J. L. Laake. 1980. Estimation of density from line transect sampling of biological populations. Wildlife Monographs 72.
Eberhardt, L. L. 1978. Transect methods for population studies. Journal of Wildlife Management 32:1-31.
Gates, C. E. 1979. Line transects and related issues. Pages 71-154 in R. M. Cormack, G. P. Patil, and D. S. Robinson, editors. Sampling biological populations. International Cooperative Publication House, Fairland, Maryland.
Laake, J. L., K. P. Burnham, and D. R. Anderson. 1979. User's manual for program TRANSECT. Utah State University Press, Logan, Utah.
Laake, J. J., S. T. Buckland, D. R. Anderson, and K. P. Burnham. 1993. DISTANCE user's guide, version 2.0. Colorado Cooperative Fish and Wildlife Research Unit, Colorado State University, Fort Collins, Colorado.
Revised: 19 October 2010