Annual mortality (or survival) rate varies only with age of the bird, no time-specific variation is allowed.
Annual recovery rate is constant fraction of annual mortality rate (i.e., reporting rate is assumed to be constant over all ages and years).
Virtually none of the banded birds remain alive when the data are analyzed.
There is no year-to-year variation in either harvest rates or band-reporting rates.
There is no loss of bands (note: violation of this assumption is especially serious under the C-D life table method).
Must wait until all individuals have died
Reporting rate not a constant...often varies by age (violates assumption #2).
Often a high correlation between survival rate and reporting rate (violates assumption #2).
Band loss rates produces a negative bias in estimates of survival (violates assumption #5).
Band loss and mortality of banded birds cannot be differentiated in life-table methods (an especially serious problem when working with long-lived species).
Banding data (mostly birds) have been improperly analyzed using life-table methods... and has resulted in confusion and incorrect interpretations (Anderson et al. 1981, 1985).
Assumptions of any specific model are explicit and often appear quite general and realistic.
Goodness-of-fit tests allow the assumptions of any given model to be tested.
Choice of "best" fitting model is based on tests between models and goodness-of-fit tests.
Use of maximum likelihood estimators (MLE) results in consistent estimators that have smaller variances and, therefore, are more precise.
Annual changes in band-reporting rates do not bias the estimates of survival rates if recovery rates are allowed to be year-dependent.
Estimates of sampling variances and covariances can be computed as a measure of precision.
Can statistically test null hypotheses about average survival in 2 geographic areas.
Do not have to wait until all animals have died to analyze data.
Can estimate survival/mortality with fewer assumptions than with C-D life table methods.
Analysis is based on a stochastic model structure.
Do not get age-specific survival estimates (in most cases).
Requires huge banding effort, especially for species with a low recovery rate.
Survival rates cannot be determined for the last banding year.
| Note: survival rates cannot be estimated accurately if only young are banded... regardless of the method used! |
F = recovery rate
r = band-reporting rate
Hr = harvest rate
Kr = kill rate
Mr = annual mortality rate
Program MARK: Interactive program allowing the design of particular models of interest.
Program ESTIMATE: Age-independent models (i.e., banding data for adults only).
Program BROWNIE: Age-dependent models (e.g., banding data for adults and juveniles)
Program SURVIV: Powerful program designed for radio telemetry data but can be used to analyze banding data.
Several others...
VI. Program MARK
Program MARK allows you an almost unlimited number of models that you can develop to analyze your data set. This program also can handle a wide variety of data types and performs a numerous array of estimation procedures. The unlimited number of models that MARK allows you to run for a given data type is an artifact of the design matrix and parameter index matrices. These features allow you to create the various biologically relevant models that you want to test for your data set. For this lab we will only utilize the parameter index matrices (PIMs). MARK also uses powerful analysis methods and statistical procedures to develop and test models.
A. Models
Models can be created using the parameter index matrices (PIMs), which are matrices used to identify individual survival and recovery rates relative to year of capture (cohort) and year of recovery. Let’s build a simple example for 4 banding occasions and 4 years of band recovery. First we will build the matrix of expected proportions (the product of survival and recovery probabilities) for time dependent models, then we will break this apart to develop the PIMs. For our example, the matrix of expected values is:
r1 s1r2 s1s2r3 s1s2s3r4
r2 s2r3 s2s3r4
r3 s3r4
r4
The rows indicate year of banding and the columns are the year of recovery. The first cell in the first row is the probability of recovery (r) during the first year of recovery. The second cell is the probability of surviving (s) the first year and being recovered the second year. As you follow these probabilities you see that recovery and survival rates depend on the year of recovery but not on the year of banding (vary across columns but not across rows).
Now we will build this in the form of PIMs but also add in two groups (g) representing males and females that have different survival rates. The numbers in the PIMs identify individual parameters in a linear model. The actual value in each cell is meaningless, they are just identifiers. So we will build 4 different models using 4 recovery periods to help you understand the design of the PIMs.
The functions associated with each model include the following notation:
s = probability of survival function
r = probability of recovery function
g = group variable (e.g., sex)
t = time variable (e.g., year of recovery)
MODEL [s(g t) r(g t)]: Recovery and survival rates vary across time (year of recovery) and between groups (sex).
Male Survival Female Survival
1 2 3 4 5 6 7 8
2 3 4 6 7 8
3 4 7 8
4 8
Male Recovery Female Recovery
9 10 11 12 13 14 15 16
10 11 12 14 15 16
11 12 15 16
12 16
The first difference and one that must be maintained for all models is that the PIMs for survival are different than the PIMs for recovery. Within each matrix we see that the values within each column are the same. This indicates that there is no cohort effect or that the rates for animals banded in one year are the same as those banded in other years within a given year of recovery. However, the numbers are different within each row of the PIMs. This indicates that the rate varies with year of recovery. Interpreting the male survival PIM, we see that survival in the first year of recovery is different than survival in the second year, which is different that the third, which is different that the fourth. In other words survival rates are different from one year to the next. However, within a year survival rates are the same for each banded cohort. Now compare male survival to female survival PIMs. We see the exact same pattern in this PIM but with different numbers. Again we have survival rates changing from year to year but no cohort differences. Then why are the numbers different between the male and female survival PIMs? They are different because we are modeling the possibility that survival rates between males and females are different. Take the second year of recovery for example, we see that survival for all banded male cohorts is the same and survival for all banded female cohorts is the same but survival is different between males and females. Now use this same logic on the PIMs for recovery. Keep in mind that the PIMs for recovery can NEVER contain any of the same values that occur in the survival PIMs. We will now present 3 more sets of PIMs for constrained situations of the above model. Take some time and figure out what these PIMs are modeling in regards to survival and recovery rates relative to recovery year, group (sex), and cohort or year of banding.
MODEL [s(. t) r(. t)]: Recovery and survival rates vary with year of recovery but no group (sex) differences in these rates.
Male Survival Female Survival
1 2 3 4 1 2 3 4
2 3 4 2 3 4
3 4 3 4
4 4
Male Recovery Female Recovery
5 6 7 8 5 6 7 8
6 7 8 6 7 8
7 8 7 8
8 8
MODEL [s(g .) r(g .)]: Recovery and survival rates are different between groups (sex) but no differences relative to time (year of recovery).
Male Survival Female Survival
1 1 1 1 2 2 2 2
1 1 1 2 2 2
1 1 2 2
1 2
Male Recovery Female Recovery
3 3 3 3 4 4 4 4
3 3 3 4 4 4
3 3 4 4
3 4
MODEL [s(. .) r(. .)]: Recovery and survival rates do not differ relative to group (sex) or time (year of recovery).
Male Survival Female Survival
1 1 1 1 1 1 1 1
1 1 1 1 1 1
1 1 1 1
1 1
Male Recovery Female Recovery
2 2 2 2 2 2 2 2
2 2 2 2 2 2
2 2 2 2
2 2
Take the time to go through all of these models and make sure you understand them. They are crucial to understanding how the program works and how to interpret the results. Once you understand these models see what other biologically relevant models you could come up with.
A. Selecting the best model
1. Goodness-of-fit -- important to evaluating an individual model, but not necessarily helpful in model selection.
2. Tests between models (likelihood ratio tests) -- models must be nested.
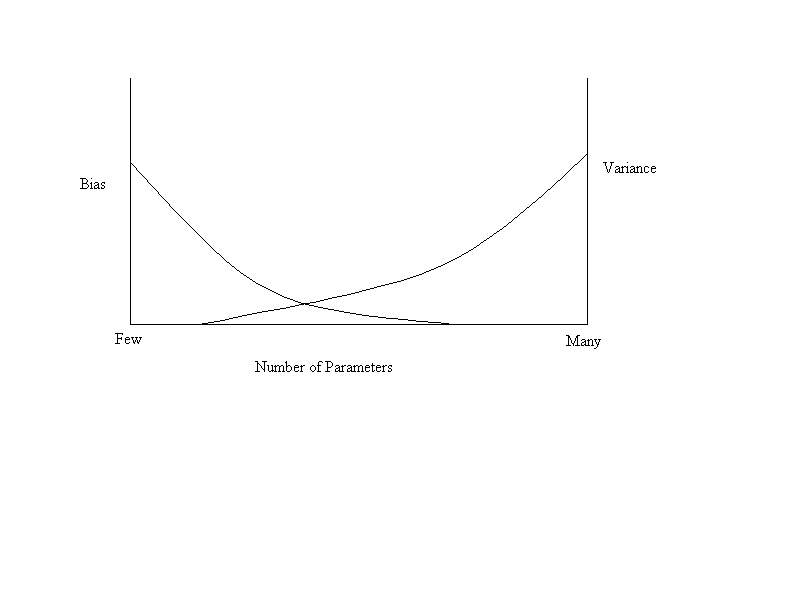
3. Information criteria -- balancing trade-offs between bias and variance.
Akaike’s Information Criteria (AIC)
Mathematical and statistical models are very important tools for ecologists. We build models to try to answer biologically relevant questions. We use models to try to predict how a variable will act in a system or how the entire system will respond to an individual variable or a group of variables. How do you decide how many terms or variables to include in the model?
A basic concept behind building any type of model selection criteria is finding a balance between bias and variance. Bias is the difference between the expected value and the true value. Variance is the mean squared deviation of individual observations from their mean. Minimization of variance leads to a more accurate estimate. The fewer the number of terms in the model, the lower the variance due to fewer estimations that need to be calculated. Conversely, the more terms included in the model, the smaller the bias.
AIC is a statistical calculation used to determine how many terms are appropriate for the model given the situational data. An AIC statistic is calculated for each model, constantly comparing it to the full model or the model containing all of the possible variables.
The model producing the lowest AIC statistic is considered to be the best choice. AIC is an objective approach where the particular modeler does not choose their favorite. Any inferences from the model are only those justified by the data.
AIC is based on the Kullback-Leibler "distance" between two models where:
AIC = -2 ln(L) + 2 K
- The first term [-2 ln(L)] is a measure of the lack of fit, where ln(L) is the value of the log-likelihood function evaluated at the maximum (or the deviance from the "true model").
- The second term [2 K] is a "penalty" for the addition of more parameters, where K is the number of parameters in the model.
VII. Assumptions of Modern Analysis Methods
| Note: In practice, assumption #9 is a series of very specific assumptions that can be tested using information from the recovery array. These assumptions specify the exact model structure (i.e., Model 1, Model 2, etc.) and usually are the only testable assumptions in most banding studies. |
Generally, the survival rate is for the period between bandings (i.e., it is not the survival rate for the period between hunting seasons). Of course, this depends on when banding occurred.
The time interval between banding periods is assumed to be equal (e.g., banding occurred early each fall, prior to migration).
Studies where only a few birds are banded each year (e.g., <300) usually result in poor estimates (i.e., large variance). In addition to the total number of birds banded, recovery rate also affects sample size. For example, a species having an average recovery rate of <1% (such as blue-winged teal and American woodcock) require a very large banding effort (e.g., 2,000 to 3,000 birds per year) before survival and recovery can be estimated with any precision (and accuracy). BAND2 is a computer program for estimating sample size requirements.
Effects of band loss, late reporting, heterogeneous survival rates, etc.
band loss: May result in slight negative bias. Significant problems only with long-lived species experiencing severe band loss.
late reporting: Delayed reporting can result in a overestimates of survival. However, models in program ESTIMATE are generally robust to delayed reporting of band recoveries.
heterogeneous survival rates: If sampling is nonrandom and heterogeneity of survival and recovery rates is present, then any estimates could be misleading (e.g., tend to underestimate annual survival). If survival rates are homogeneous but recovery rates are heterogeneous, then there should be no bias in survival estimates. Note: heterogeneous rates can result from having various "subgroups" in your data set (e.g., subpopulations of Canada geese, males and females, pooling banding data from several geographic areas, etc.)
Modern analysis methods for banding data are potentially applicable to a wide range of field studies in addition to bird banding. For example, fish-tagging studies, bat banding, marking studies of herpetofauna, marine and terrestrial mammals, and a wide variety of entomological investigations.
Brownie, C., D. R. Anderson, K. P. Burnham, and D. S. Robson. 1985. Statistical inference from band recovery data – a handbook. Second edition. U.S. Fish and Wildlife Service, Resource Publication 156, Washington, D.C., USA.
Revised: 28 November 2011