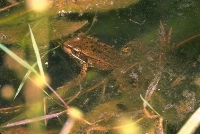
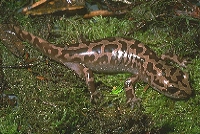
During September 1996, Dr. Lohman and volunteers (you!) sampled Mountain Gulch and Eldorado Gulch streams to estimate abundance of the tailed frog (Ascaphus truei) and Idaho giant salamander (Dicamptodon aterrimus). Total counts were conducted on 2 sample "plots" of 2 sizes (5-m and 30-m stream reaches) in each stream. Mark-recapture data on individuals in each of these plots was also recorded. In addition, length of all tailed frogs was recorded to evaluate the age structure of each population. Data on captures and lengths have been summarized and are available in the following tables:
Summary of capture data from Mountain Gulch:
Summary of capture data from Eldorado Gulch:
Summary of 1995 results (adult frogs only) from total counts conducted in 5-m reaches of each stream:
Stream Mean SE Unit of Measure Mt. Gulch 1.20 0.14 per meter Eldorado Gulch 0.47 0.14 per meter Mt. Gulch 0.86 0.22 per m2 Eldorado Gulch 0.22 0.08 per m2
Note: SE = SQRT (variance / n), where n = sample size.
| Use the class data and your recent experience with amphibian-survey techniques to answer the following questions: |
Animal density could be calculated using #/m2 or #/linear meter. Which might be a better measure for the tailed frog (Ascaphus truei)? (2pts)
Use the class data to compare these density measures (#/m2 versus #/linear meter) across streams. In other words, calculate the mean, SE, and 95% confidence interval for tailed frogs (adults and tadpoles) and giant salamanders in each stream using the 2 units of measure. Note: the 95% CI = mean ± 2 (SE). (3pts)
Use Bailey's mark-recapture estimator to estimate the population size of tailed frogs (adults) and giant salamanders in each stream (based on data from the 60-m reaches). Place a 95% CI on your estimates. Compare your estimates to Dr. Lohman's estimates (which were derived a month earlier). Are they different? If so, speculate on WHY. (8pts)
Can you test the assumption of "equal catchability" if you use Bailey's estimator? Why can't you use program CAPTURE to "test" the equal catchability assumption and select the best estimator/model for these data? (2pts)
Compare population estimates for the tailed frog (tadpoles and adults separately) between counts made in the 5m reaches and the 30m reaches. Which appears to be a better method of sampling the tadpoles? Adults? Why? (5pts)
The tailed frog lives to be about 15 years old and becomes reproductive at about age 9. Dr. Lohman has observed from previous collections that tadpoles and reproductively mature individuals are regularly and frequently collected, but sexually immature individuals are not. What might be going on here? How could you test your hypothesis? (3pts)
Construct a histogram (i.e., bar chart) of count versus length for tadpoles in each stream. (4pts)
How many age (size) classes do there appear to be in your histogram? Explain the difference between what you observed and the known life history of this species (i.e., it has 3 tadpole stages in this part of its range). (2pts)
Based on your observations and experience in the field, describe at least one potential source of variability or "error" in this study. Briefly discuss how you might reduce variability or remove/quantify the error(s) in future studies. (3pts)
Why might it be important to monitor the population and "age" structure of the Idaho giant salamander and the tailed frog in these streams? (3pts)
Grammar/Neatness/Organization (5pts)
TOTAL POINTS = 40
Turn your answers in at the beginning of Monday's lecture.
![]() See HELP/HINTS
See HELP/HINTS
 |
 |
 |
Revised: 10 June 1998