Modeling Simulations
| The volume of data returned by LiDAR scanning requires us to write our own software for analysis. The top image below is an orthorectified LiDAR image of the scanned outcrop; and the bottom image is a surface roughness map used to identify fractures in outcrop. |

|
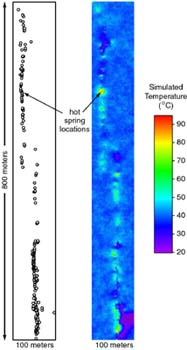 |
Statistical simulation of land surface temperature distribution along an active fault zone. Warmer colors correspond to the location of hot springs. From these analyses, we are able to estimate the distribution and relative magnitude of fault-zone permeability (e.g., warmer colors indicate higher permeability pathways). |