Fall 2002 Gary Austin gaustin@uidaho.edu
Solar Radiation Characteristics |
Click thumbnails for a detailed view |
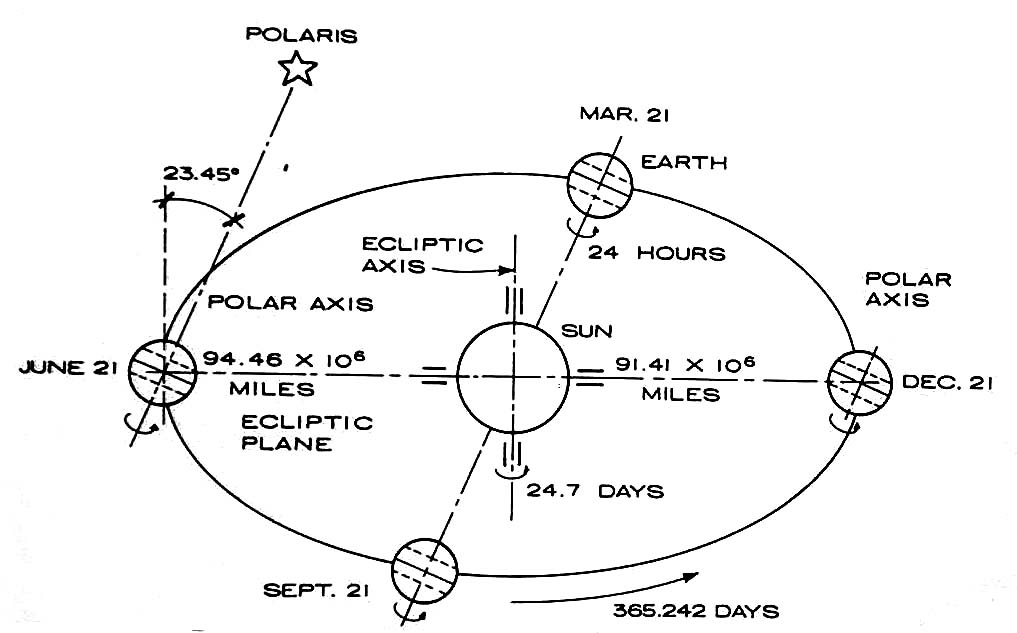
| Conditions vary according to latitude due to the tilt of the
earth relative to the the sun. Each position on earth is presented
differently each day of the year since the earth is in motion.
|
 |
Solar Access |
|
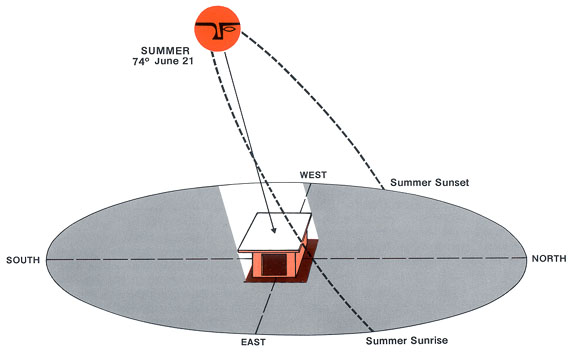
| Horizontal Position This is measured as an azimuth or as a South bearing and defines the horizontal variation in the position of the sun as it travels across the sky during the day. Altitude The angle of sun in the sky is defined by the altitude. When the azimuth and the altitude are both known then the sunlight striking windows and the length of shadows cast can be estimated. These are, of course, important for energy conservation in buildings and the creation of microclimates outside the building. |
 |
| Winter Sun Path |
|
| Summer Sun Path |
 |
Solar Path Diagrams |
|||||||||||
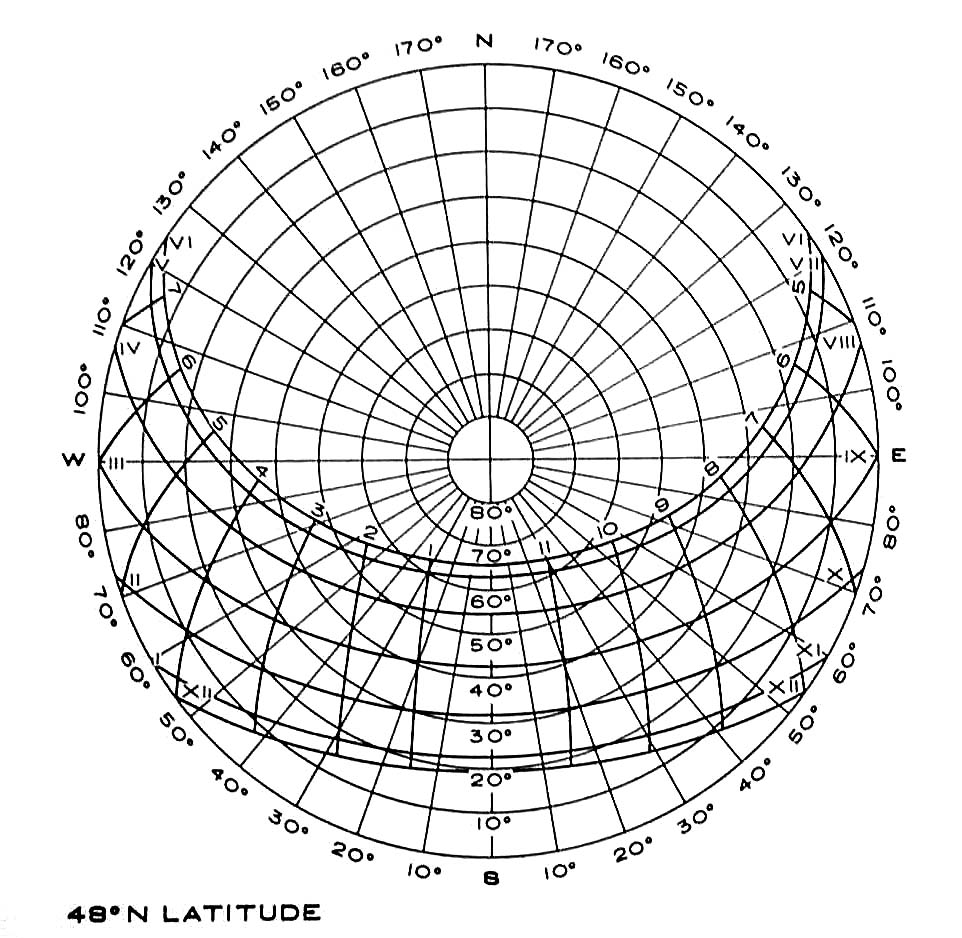
| Solar Path Diagram 48 Degrees
This diagram would be used for Moscow since we are at about latitude 46.8N at latitude 116.7W. It is used to plot the position of the sun and provide azimuth (bearing in this case) and altitude. Note than the makers of various diagrams each create a slightly different graphic system.
|
 |
||||||||||
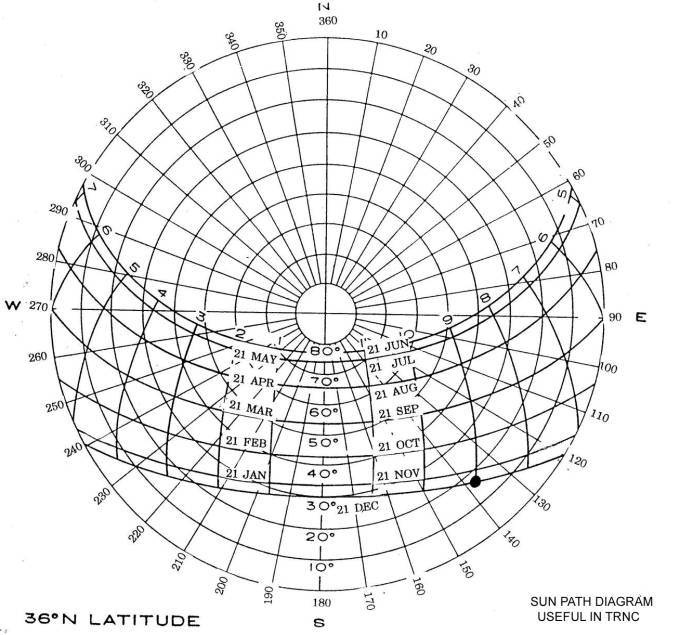
Definition of the Sun's Position (Azimuth and Altitude Angles)For a certain location, for a certain day and hour, azimuth and altitude angles may be defined by the following procedure. For this purpose the sun path diagram prepared for this location should be used. Example : Define the position of the sun in a town near latitude 36 at 9:00 am of December 21.
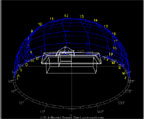
Solar Path Animation |
 |
||||||||||
| New software tools allow more accurate calculation of sun position and three dimensional representations of the path at various time of day and year. |
 |
||||||||||
|
One such tool is available at the Weather
Tool site. Sun angle calculator on the web |
|||||||||||
| Building Shape and Orientation for Energy Conservation | |||||||||||
|
Rectangular: 1:1.6 proportion Orient long façade toward south 17 ½ degrees east of south for temperate climates
|
|||||||||||
|
The building design proposal illustrated in these sections is based on the use of a sun path diagram created by the Libbey Owens Ford company. It is a more complex tool that provides profile angles, solar incidence and day-lighting information not available on the simpler diagrams that we have studied. We will spend more time using this system once we have preliminary
building footprints on our West Farm Project. The instructions on
the use of the Sun Angle Calculator is provided on line at |
|
||||||||||
|
|
|||||||||||
Wind |
|||
|
Weather stations data at the University of Idaho
Search for "Inside Idaho" Jan Feb Mar Apr May Jun Jul Aug Sep Oct
Nov Dec Ann |
|||
| Weather stations collect wind direction and speed
data. Most airports have on-site weather stations and are a good
source of local information.
Data on wind is often presented in tabular form but a "wind rose" diagram is especially useful and readable by visual thinkers
|
|||
|
|||

|
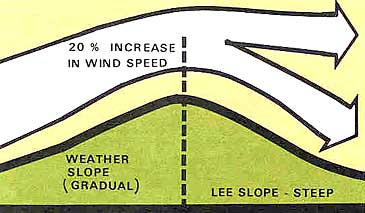
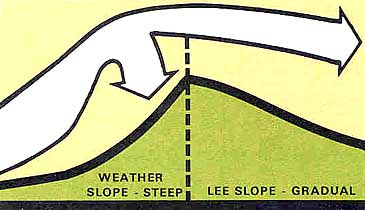
The weather on the lee slope of a hill is usually quieter than on the weather slope. However, this may be reversed if the weather slope is steeper than the lee slope. When the boundary layer of air is compressed as it passes over a ridge, wind speed is usually 20 percent greater on the top of the ridge than on the slopes. |
| Weather data |
| Average High JAN FEB MAR APR MAY JUN JUL AUG SEP OCT NOV DEC YEAR 35.6 41.3 49.0 57.5 65.9 73.1 82.6 84.0 74.4 60.5 43.1 35.5 58.5 |
| Average Low JAN FEB MAR APR MAY JUN JUL AUG SEP OCT NOV DEC YEAR 23.2 26.8 31.2 35.4 40.6 45.2 48.4 48.7 42.9 36.0 29.9 23.6 36.0 |
| Monthly Precip JAN FEB MAR APR MAY JUN JUL AUG SEP OCT NOV DEC YEAR 2.99 2.52 2.57 2.52 2.62 1.87 1.12 1.19 1.28 2.01 3.54 3.14 27.37 |
|
|