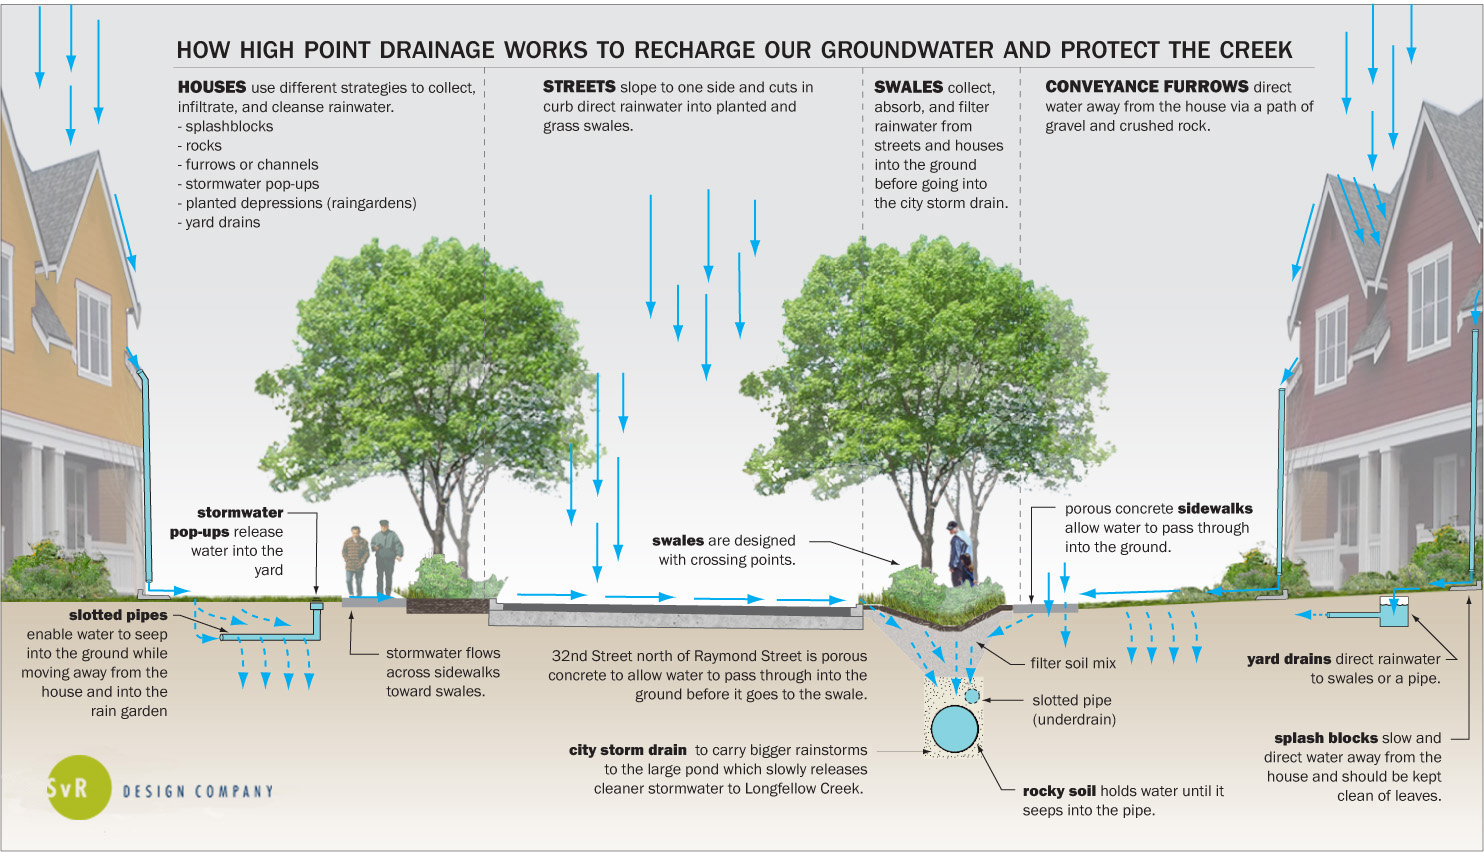
Introduction
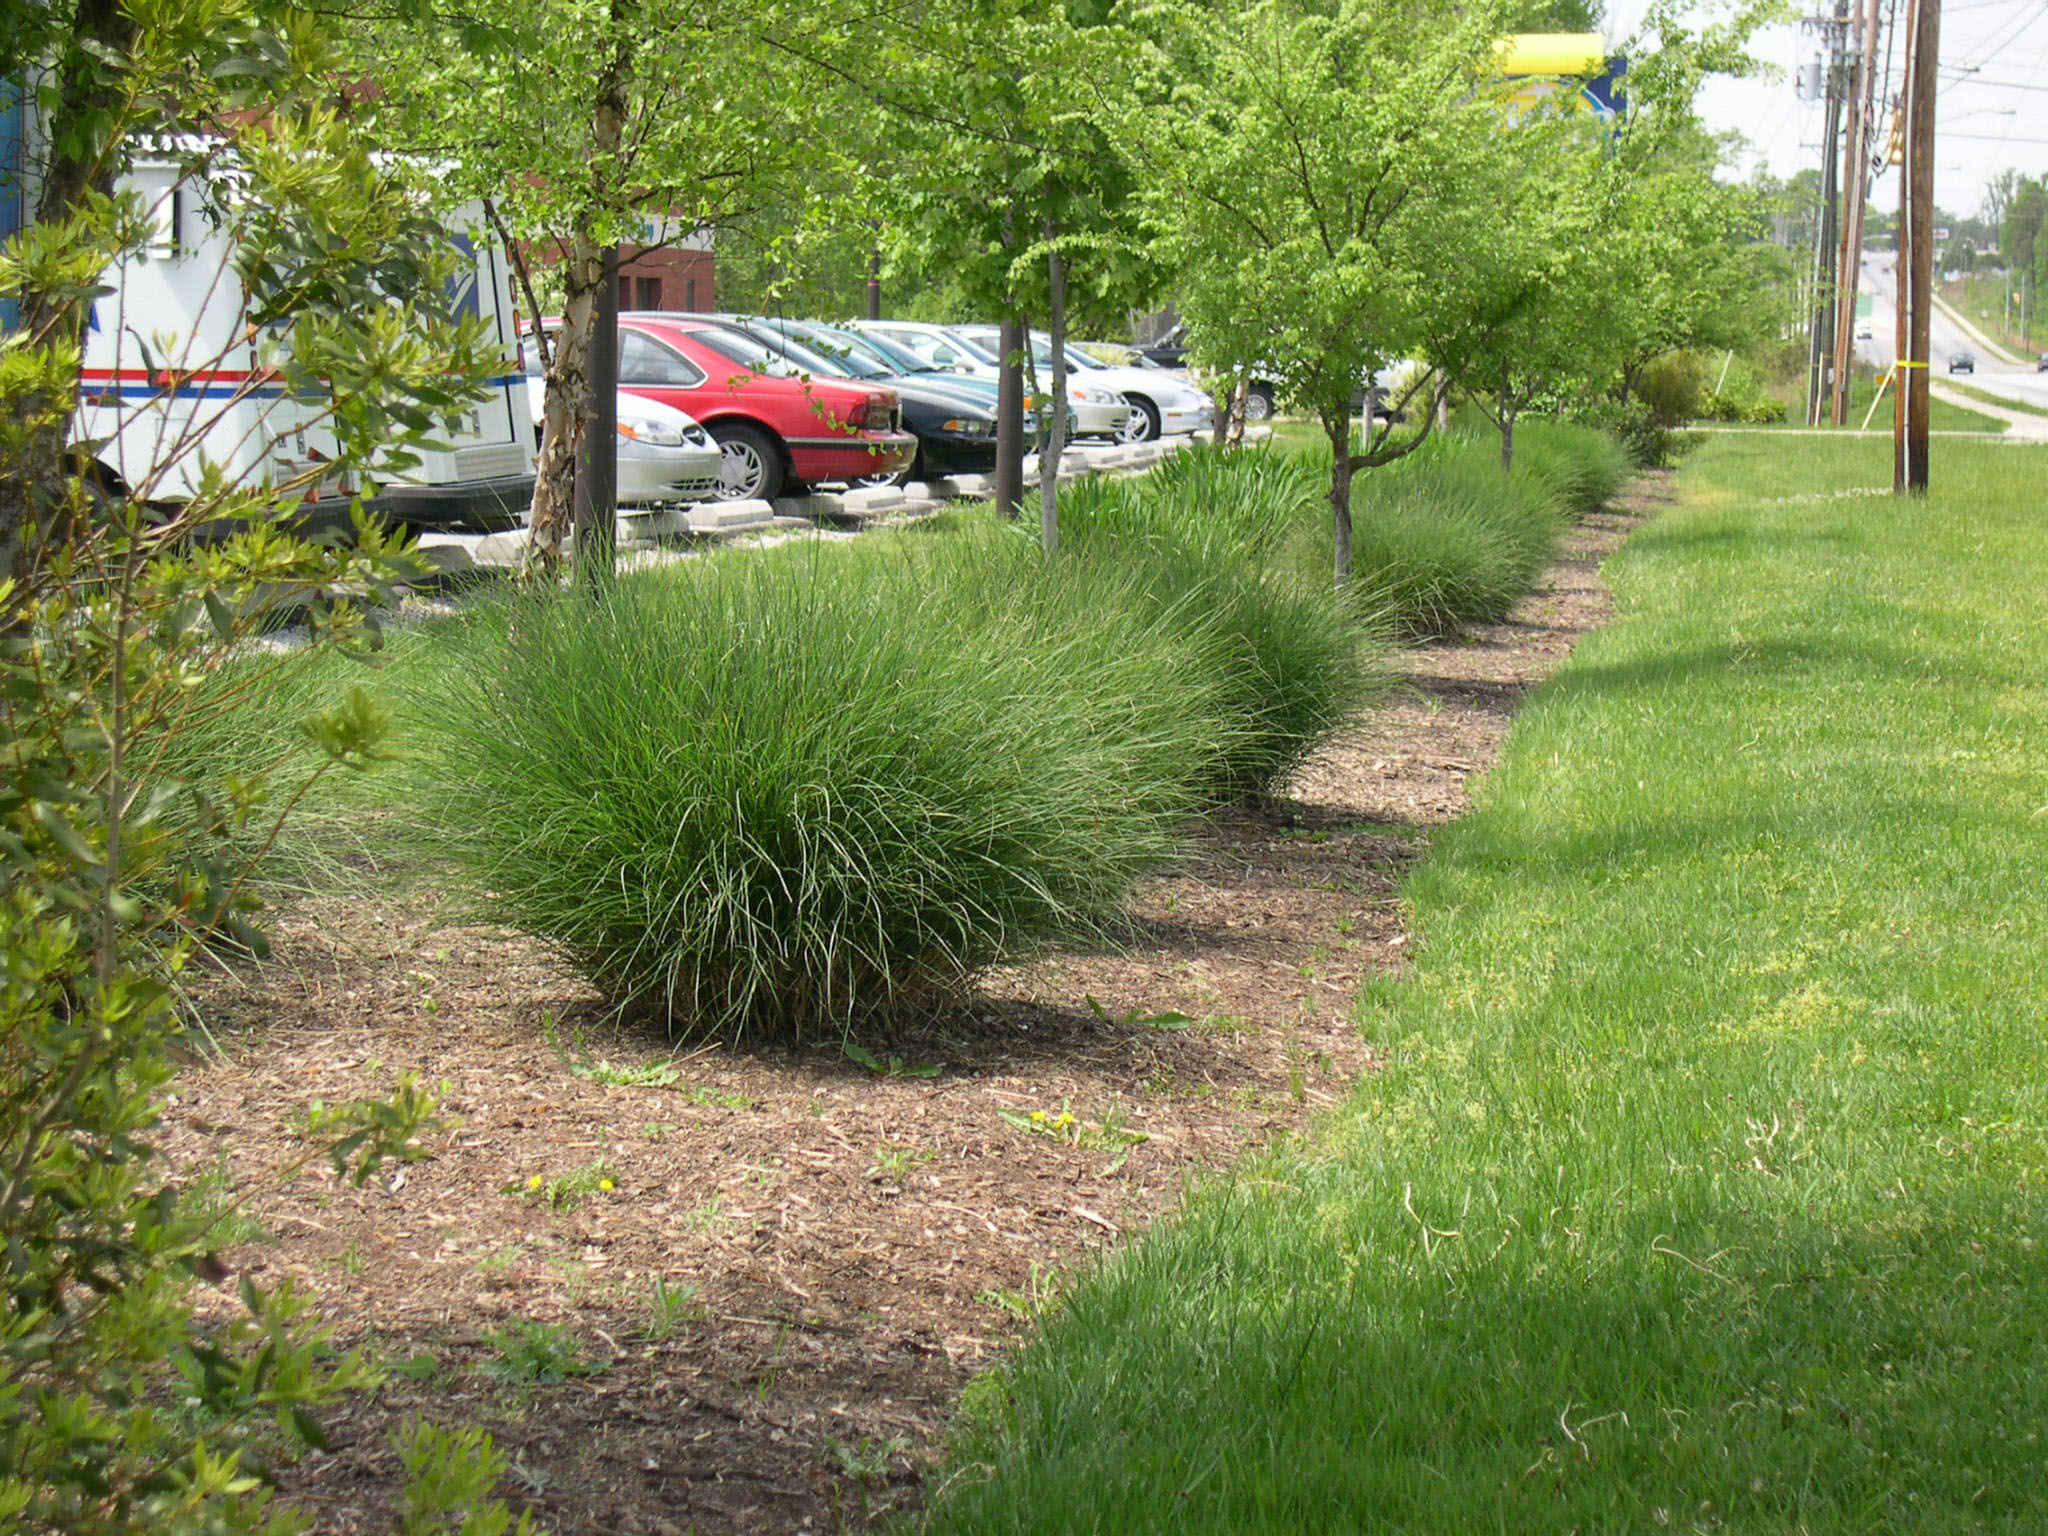
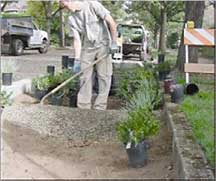
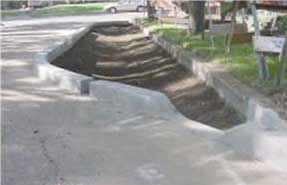
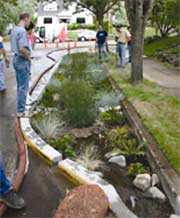
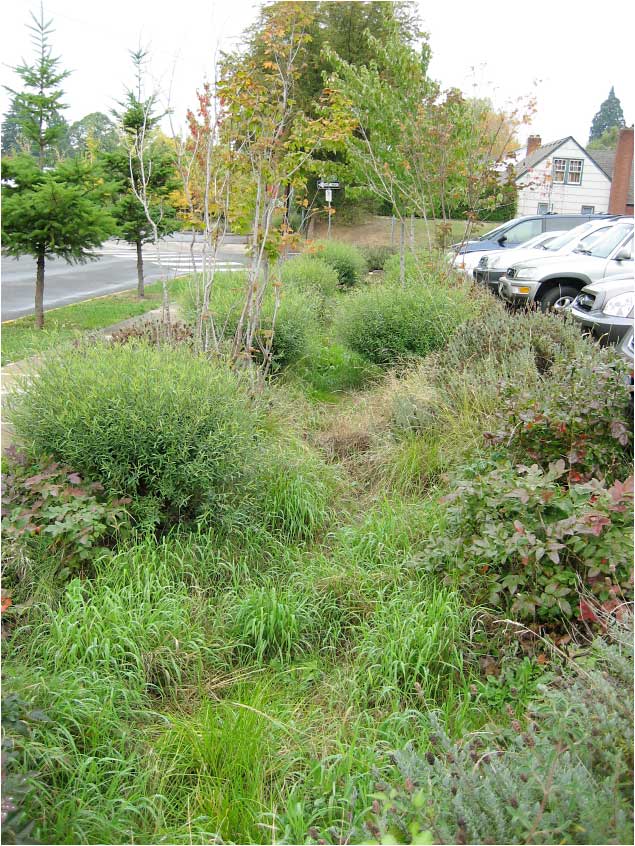
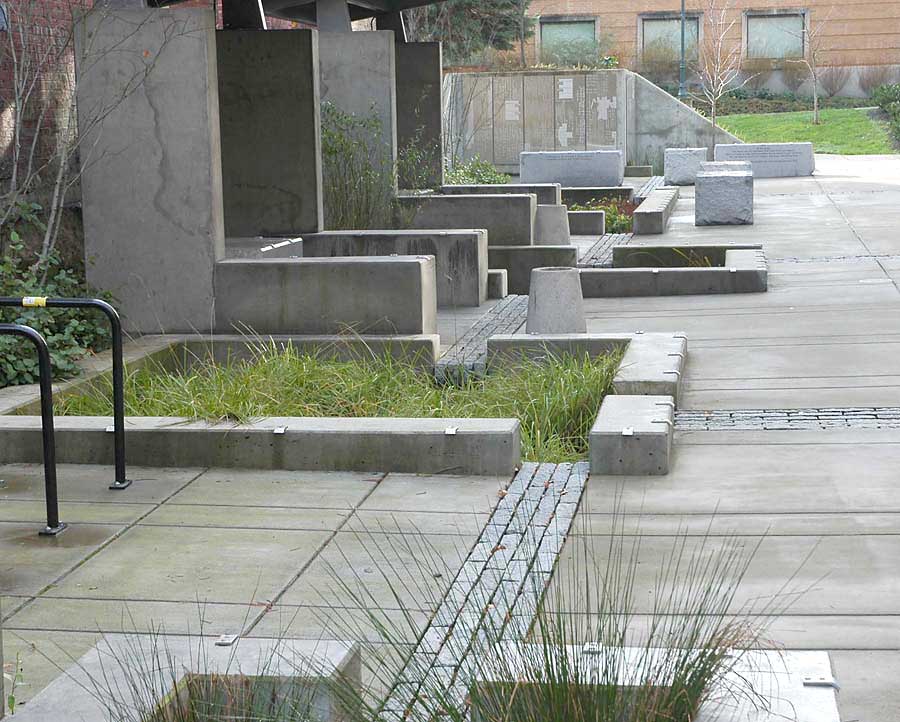
Linear Bioretention Basin in Greensboro, NC. Photo: NCSU-BAE.
There are many landscape techniques to encourage the infiltration of stormwater. This technique can provide both stormwater management as well as water quality improvement. This section presents the performance of the infiltration basin as a water management measure. We will take up the detailed study of their water quality improvement performance in a later tutorial.
Infiltration of stormwater may occur through infiltration beds (bioretention basins, rain gardens), swales or trenches. This method differs from detention since water is prevented from running off the site and is held until it percolates into the soil. It differs from retention only in that the construction is done to encourage percolation of water into the soil. In some cases this is intended to recharge aquifers but is often a way to add more water to the soil or to the root zone of plants.
Infiltration Volume
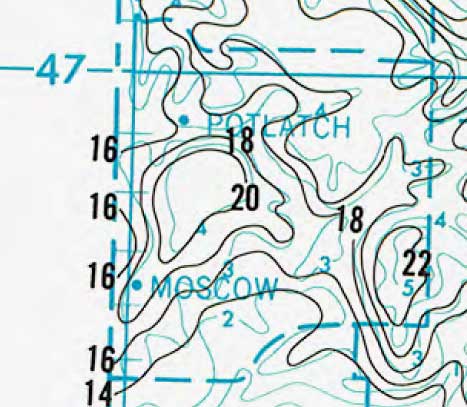
Isopluvial map showing the 2-year, 24hour rainfall depth in tenths of an inch. You can download a pdf file showing the isopluvial lines for all of Idaho. See NOAA Atlas 2, Volume 5, Precipitation Frequency Atlas of the Western United States, (1973).
The amount of water to capture and treat for water quality improvement is specified in agency regulations. However, the technique used to establish the treatment volume varies widely. This is largely because of the differences in the intensity of rain storms across the U.S. (in our area (Lewiston) the most intense rainfall (60 minute duration and 100 year frequency) is 1.1 inch). The volume captured for treatment is usually called the water quality storm.
One method of establishing the water quality storm is using the isopluvial maps published by the National Oceanographic and Atmospheric Administration (NOAA). A small portion of such a map is shown above. This image is from map illustrating the 2-year, 24-hour storm. You can see that for Moscow, ID the water depth is slightly higher than 18, which indicates 1.8" since the units are tenths of an inch. In other parts of the U.S., the 2-year, 24/hour storm is more than double the amount for Moscow. In these areas other methods are used to define the water quality storm. The simplest regulations require that 1" of the rainfall is captured and treated for water quality improvement. Capturing a 1" depth of rainfall over a site will often result in the capture of 90% of annual runoff volume, even in areas where rainstorms are intense. Treating this water volume improves water quality significantly.
If we adopt the 2-year, 24-hour storm as the water quality storm, then what is the volume of water that must receive treatment? The first step is to convert the 1.8" into decimals of a foot 1.8/12 (0.15'). If a project site was one acre (43,560 sf.) then 0.15 x 43560' = 6,534 cubic feet.
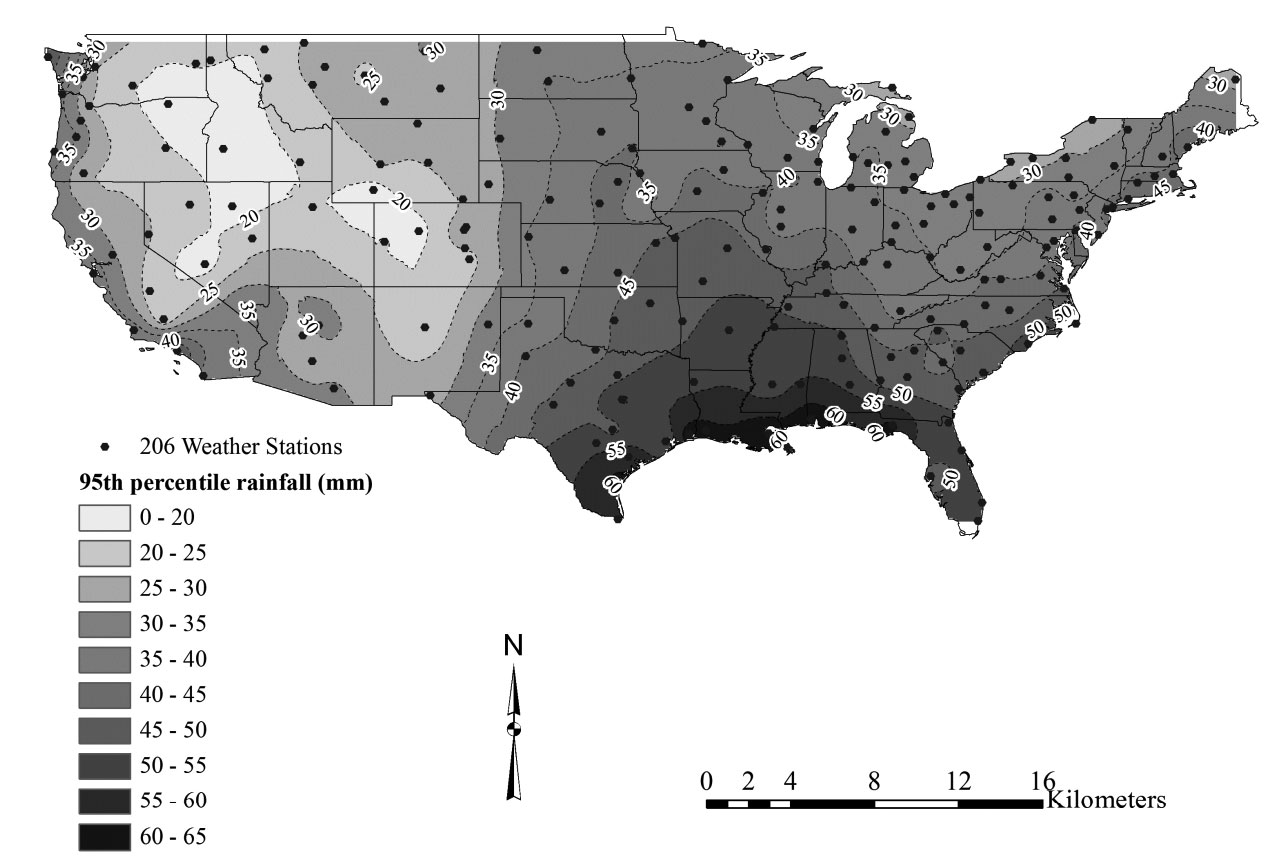
95th percentile rainfall depth. Image: Shrestha, 2013.
This map shows the 95th percentile for rainfall depth in the United States. You can see that for Moscow the depth is 25 mm (1 inch). Many agencies define this as the rainfall depth to be retained and treated on-site. For Moscow, this amount is lower than the NOAA 2-year, 24-hour rainfall amount.
Infiltration Capacity
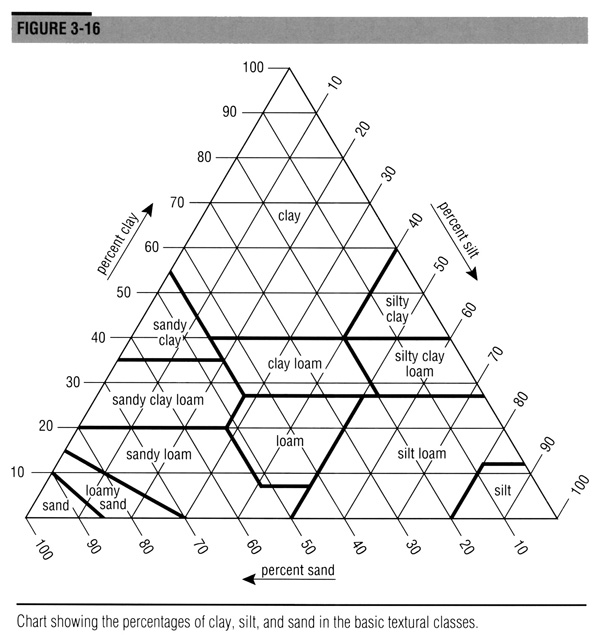
Left: Soil texture classifications. Right: Soil types for a redevelopment project site. USDA
Various soil types have different infiltration capacities based on the percentage of sand, silt and clay that they contain. The image above shows a soil classification system used by the US Department of Agriculture. Study the graphic to gain an understanding of the naming method related to the constituent elements. In particular notice the silt loam type. What is the range for percent clay in this soil type? The table below lists the particle sizes related to the various soil texture names. In infiltration basins the soil is generally modified to contain a large proportion of sand. The specifications often indicate that fractions of the total volume must pass through screens related to the sand texture classes. Often the clay and silt textures are limited to a very low percentage of the total soil.
| Name | Size (mm) |
|---|---|
| Very coarse sand | 2.0-1.0 mm |
| Coarse sand | 1.0-0.5 mm |
| Medium sand | 0.5-0.25 mm |
| Fine sand | 0.25-0.10 mm |
| Very fine sand | 0.10-0.05 mm |
| Silt | 0.05-0.002 mm |
| Clay | < 0.002 mm |
This United States Geological Service (USGS) provides soil maps and information on-line at
http://websoilsurvey.sc.egov.usda.gov/App/WebSoilSurvey.aspx. The soil map is for the site shown above. Much of the area has soil type 26 - Latahco silt loam. From the soil report an understanding of the infiltration capacity of the soil is possible. Additional detailed information is available from the US Department of Agriculture.
Soil Types on the Project Site |
|||
|---|---|---|---|
| Map Unit Symbol | Map Unit Name | ||
| 26 | Latahco silt loam, 0 to 3 percent slopes | ||
| 33 | Naff-Palouse silt loams, 7 to 25 percent slopes | ||
| 34 | Naff-Thatuna silt loams, 7 to 25 percent slopes | ||
| 53 | Thatuna silt loam, 3 to 7 percent slopes | ||
Description of Latahco
Setting
- Landform: Drainageways
- Down-slope shape: Concave
- Across-slope shape: Linear
- Parent material: Mixed alluvium and/or loess
Properties and qualities
- Slope: 0 to 3 percent
- Depth to restrictive feature: More than 80 inches
- Drainage class: Somewhat poorly drained
- Capacity of the most limiting layer to transmit water (Ksat):Moderately high (0.20 to 0.60 in/hr)
- Depth to water table: About 18 to 36 inches
- Frequency of flooding: Occasional
- Frequency of ponding: None
- Available water capacity: High (about 11.1 inches)
Interpretive groups
- Farmland classification: Prime farmland if drained
- Hydrologic Soil Group: C. Clay content - 15 to 30 percent in the top 13", from 13"-21" the clay content is 7%-22%, below 21" the clay content is 24-36%
Typical profile
- 0 to 14 inches: Silt loam
- 14 to 20 inches: Silt loam
- 20 to 28 inches: Silt loam
- 28 to 60 inches: Silty clay loam
https://soilseries.sc.egov.usda.gov/OSD_Docs/L/LATAHCO.html
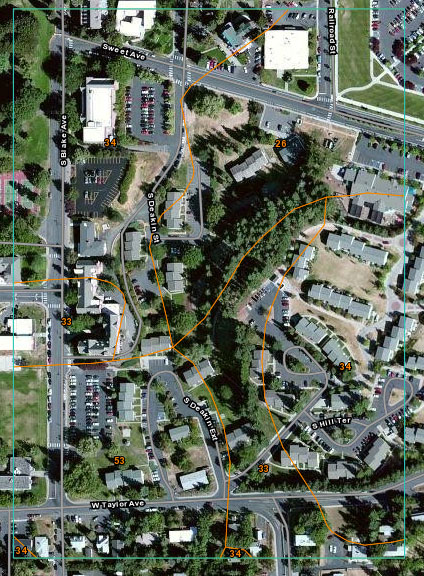
Site Evidence of Infiltration
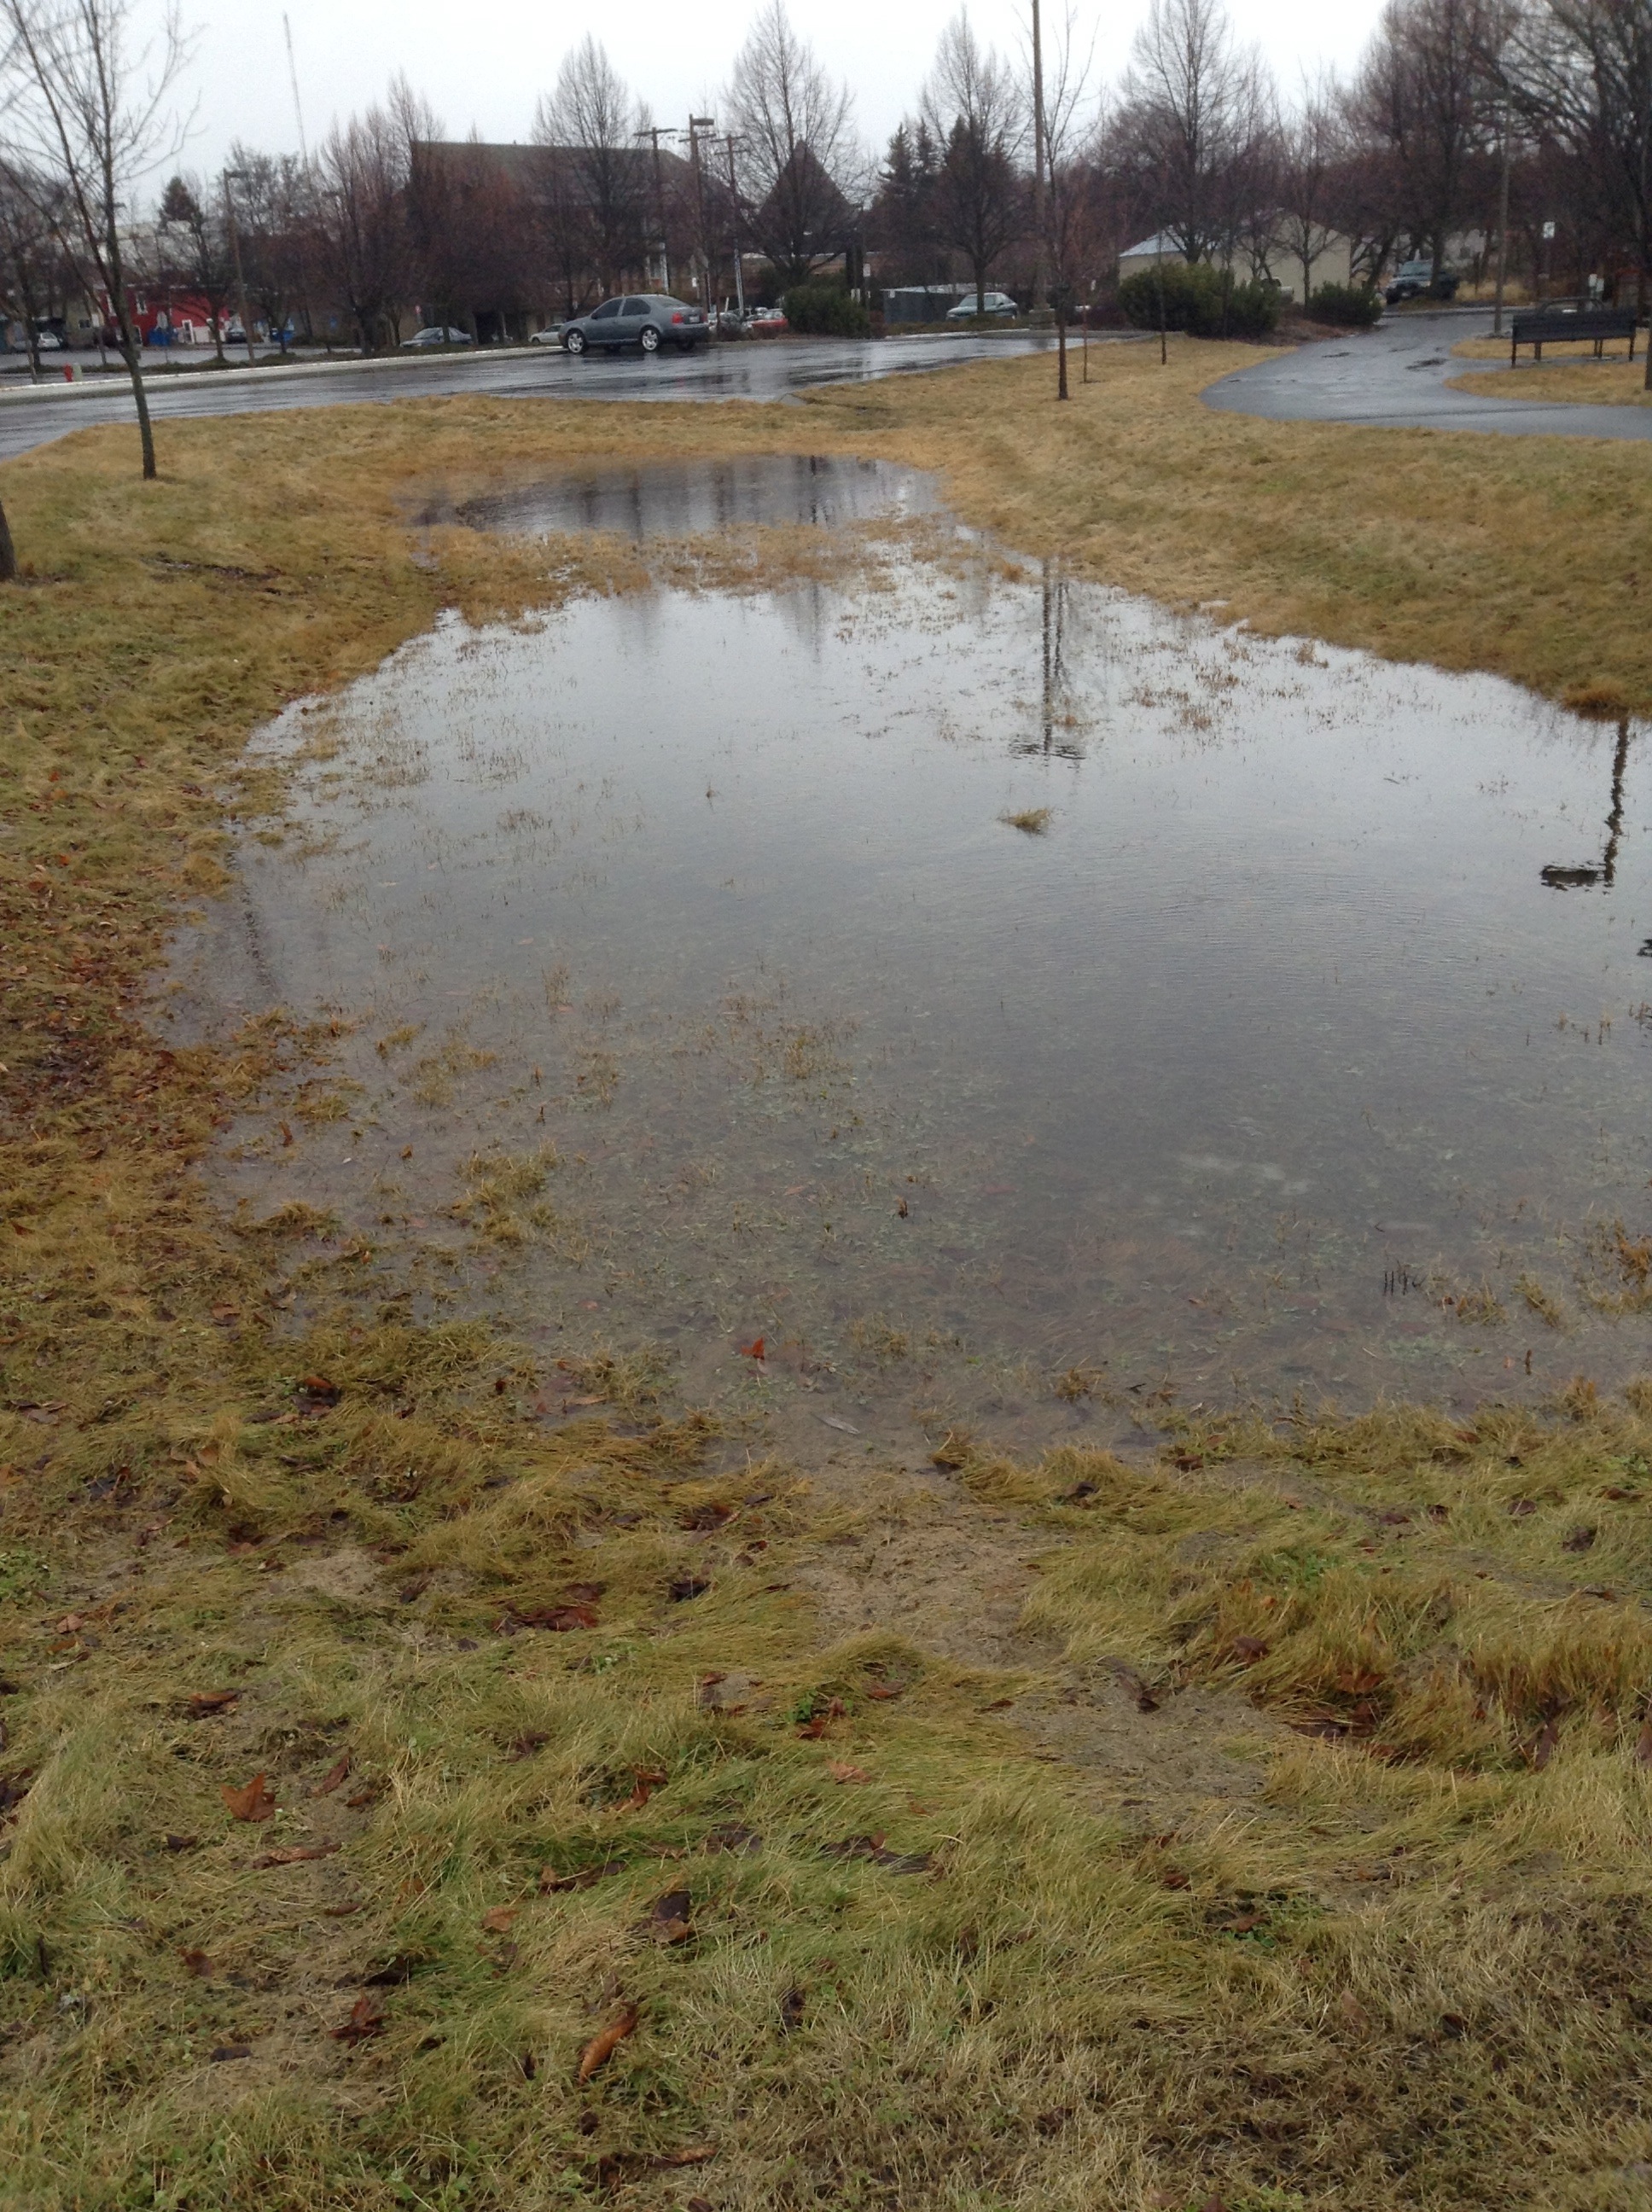
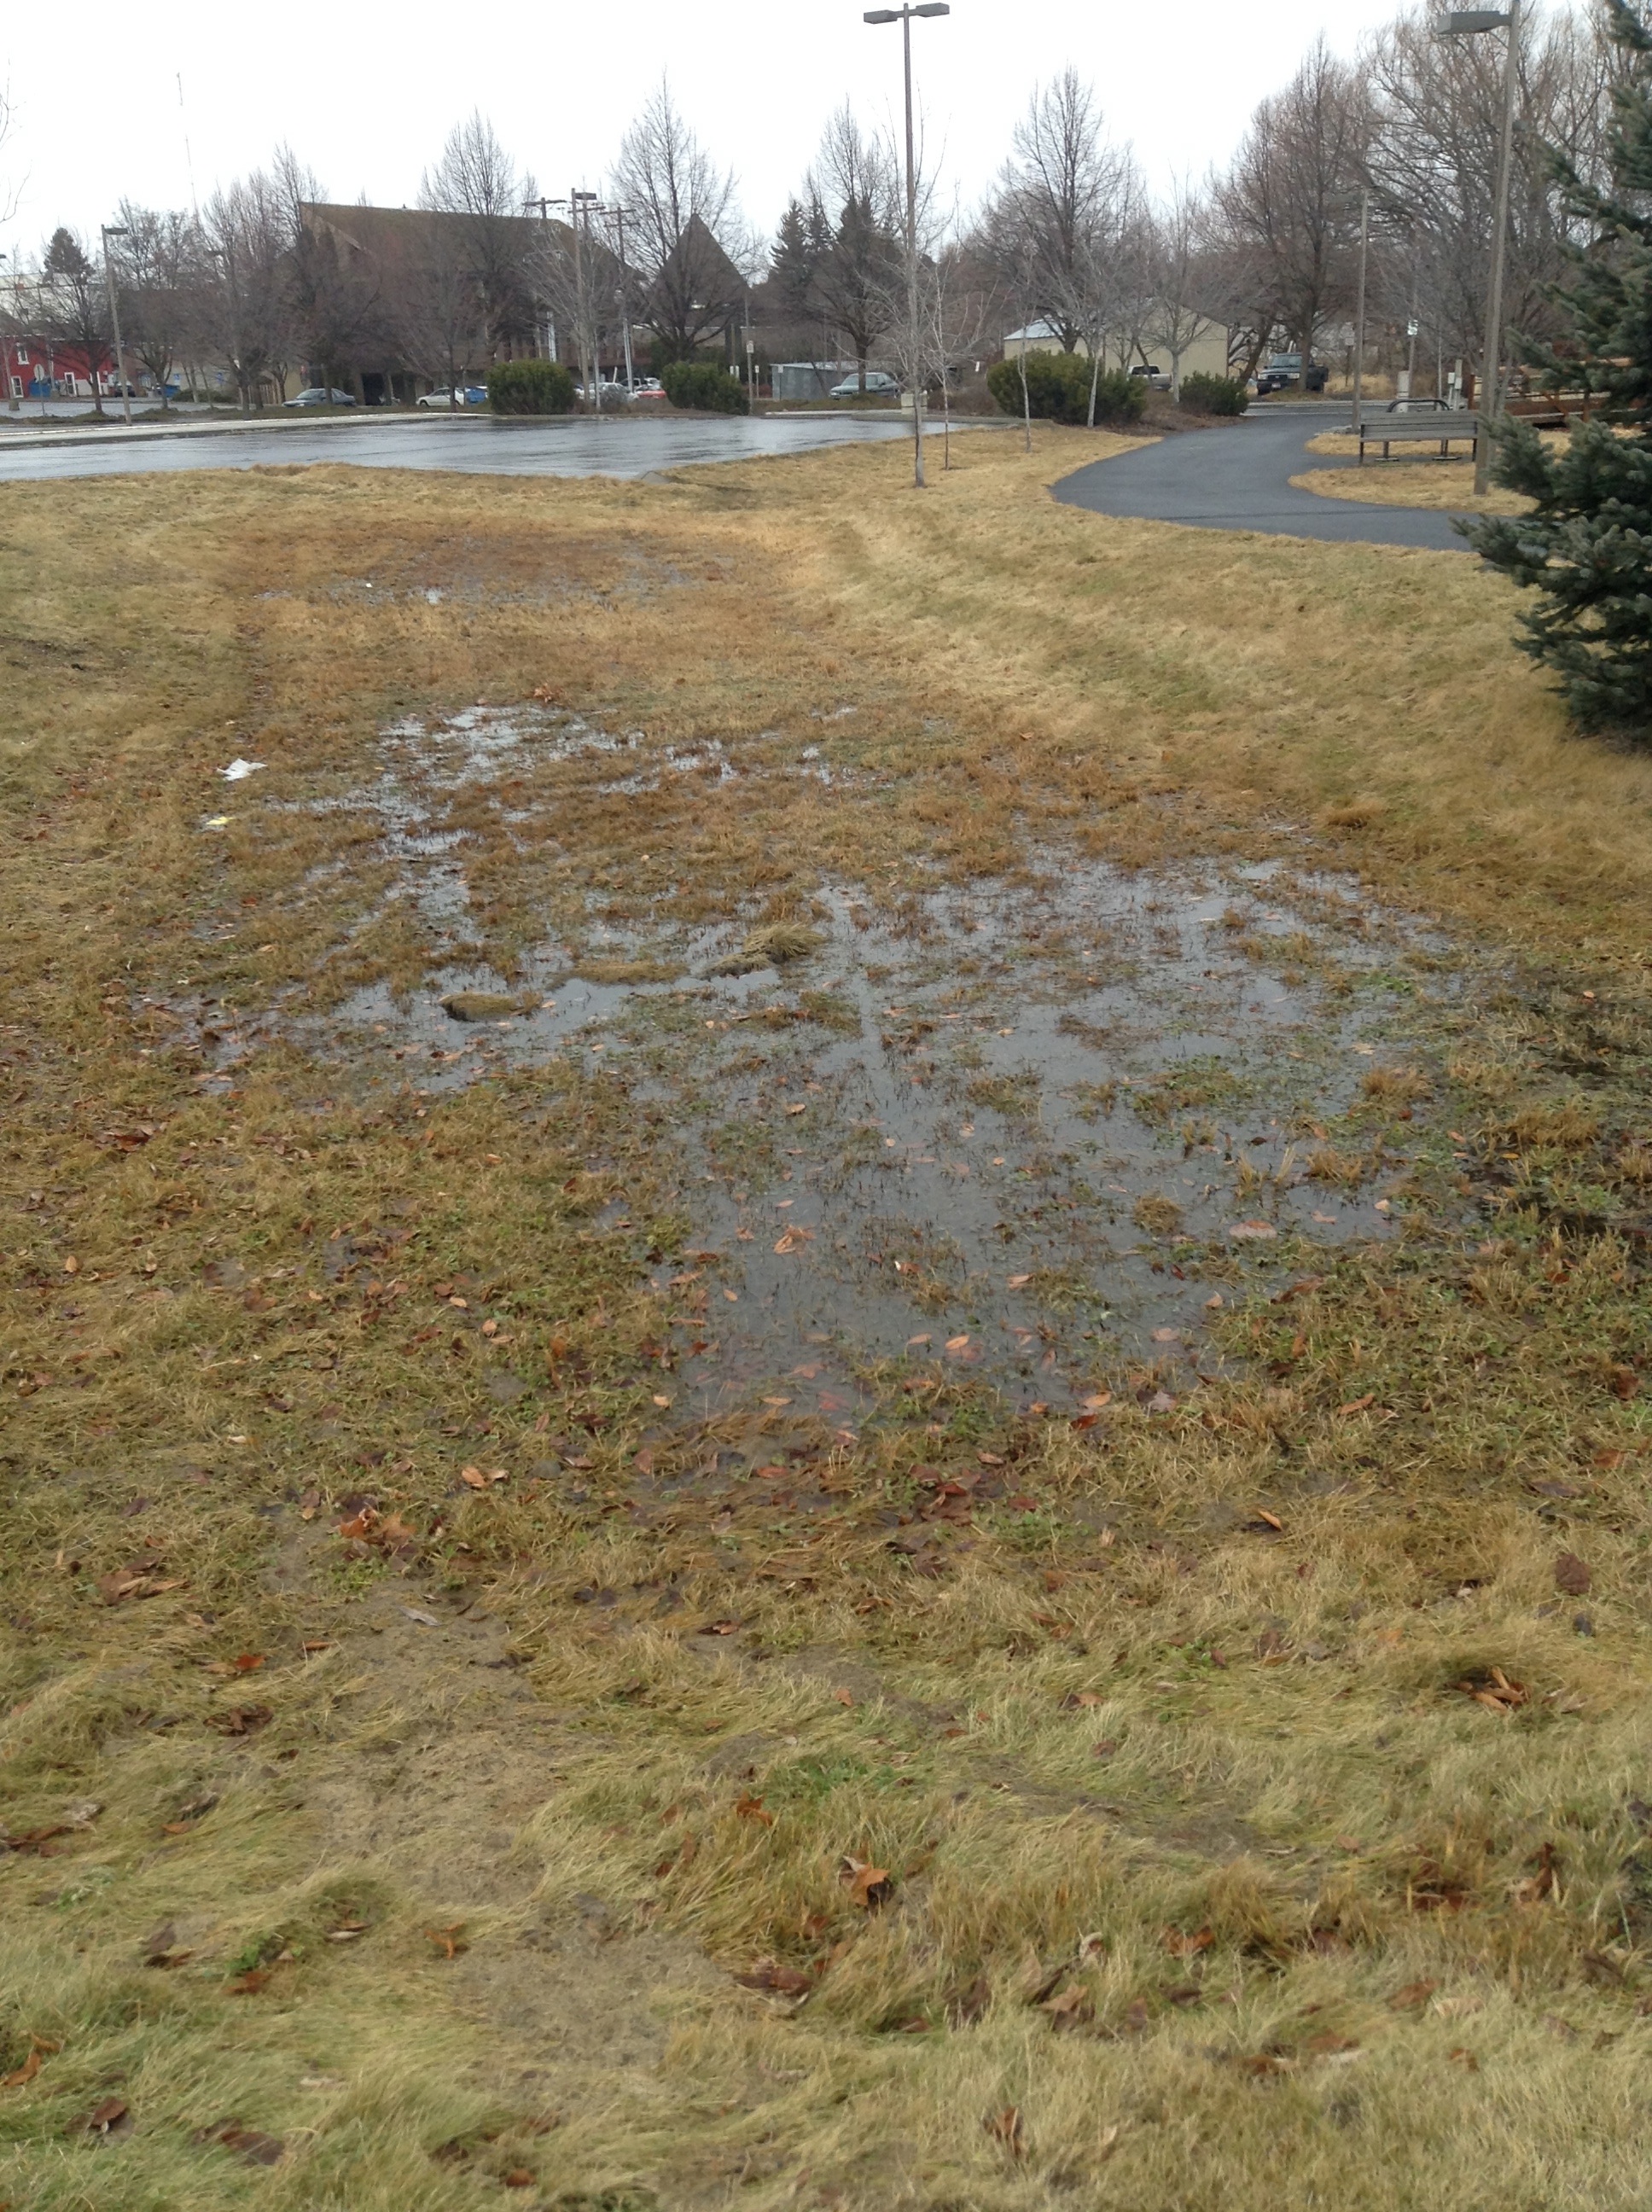
This is a retention basin in the Sweet Ave. parking lo. Soil is silt loam. Left: basin after .24" of rain. Right: Basin after 24 hours. Photos: Austin, 2014
The image above left shows temporary ponding of water near the project site and along paradise creek. The stormwater runoff is from a large parking lot and the water flows through grass swales. The soil was already saturated from rain the day before (there was .32" of rain in the 48 hours preceding the photograph). The image on the right shows the pond at the end of the storm while the image on the right shows that most of the standing water was gone 24 hours later. However, there were winds of 20 miles per hour average for about 8 hours after the photo on the left was taken. Also, the relative humidity dropped below 60% during the period of high wind. Therefore, evaporation probably played a factor in the reduction of the standing water. Nevertheless, this example illustrates that infiltration is certainly a viable practice for the project site.
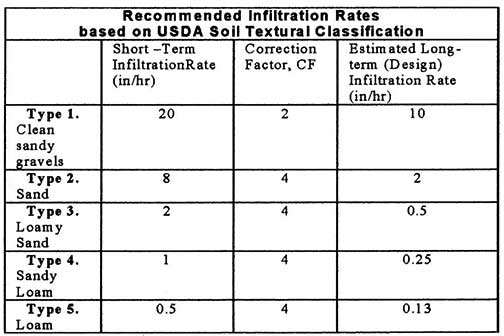
The table below defines the infiltration rate for various soil textures. Notice that Silt Loam has a rate of .5 inches per hour. This is probably too high given the amount of clay in the Latahco soil type. Use .2 inches per hour in your calculations for a more accurate rate.
Soil Infiltration Rate, Inches/Hour
Soil Texture, Type |
0-4% |
Coarse Sand |
1.25 |
Medium Sand |
1.06 |
Fine Sand |
.94 |
Loamy Sand |
.88 |
Sandy Loam |
.75 |
Fine Sandy Loam |
.63 |
V. Fine Sandy Loam |
.59 |
Loam |
.54 |
Silt Loam |
.50 |
Silt |
.44 |
Sandy Clay |
.31 |
Clay Loam |
.25 |
Silty Clay |
.19 |
Clay |
.13 |
Note: Rates based on full cover. These figures decrease with time and percent of cover. Derived from USDA information. (SCC 0812 § 1, 1990.)
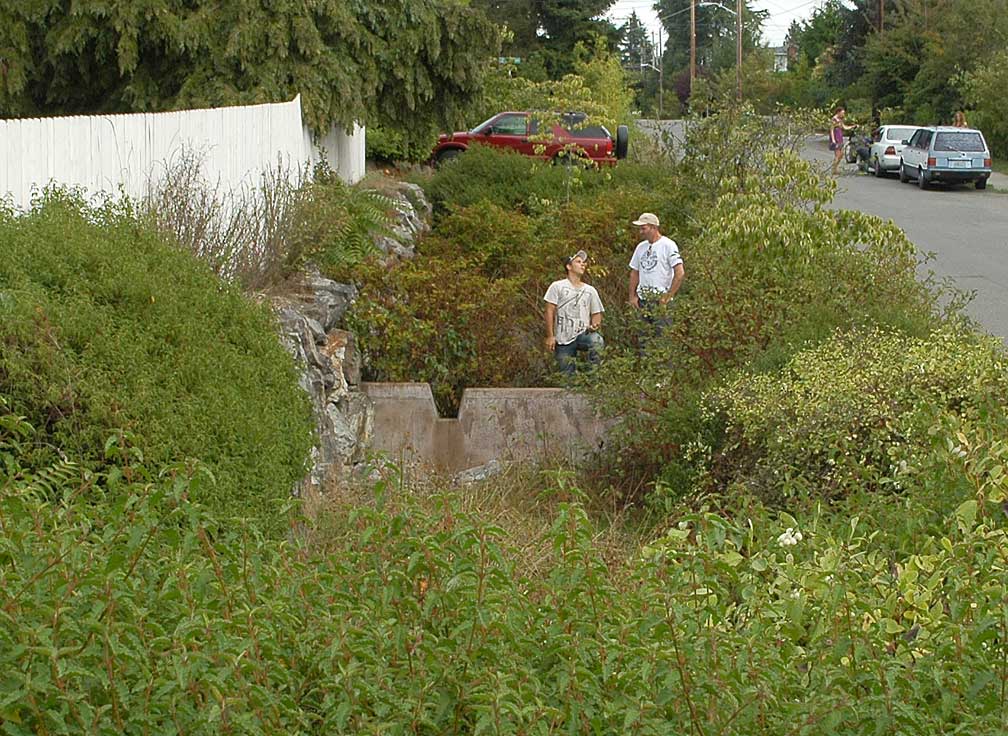
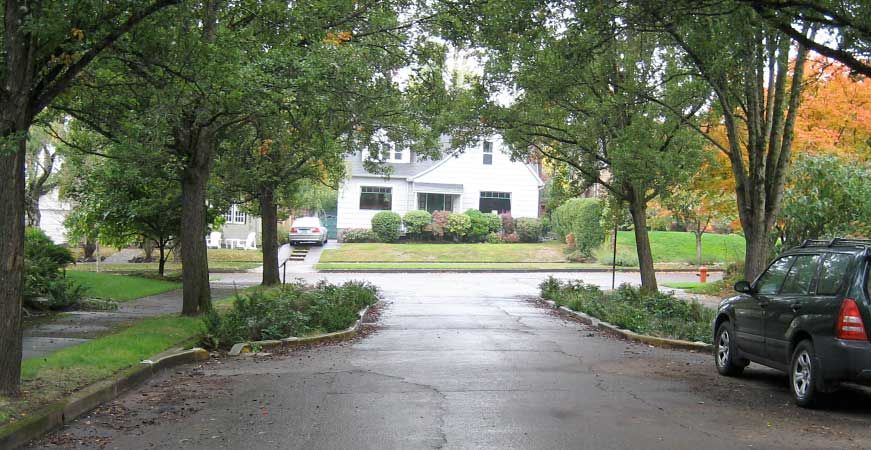
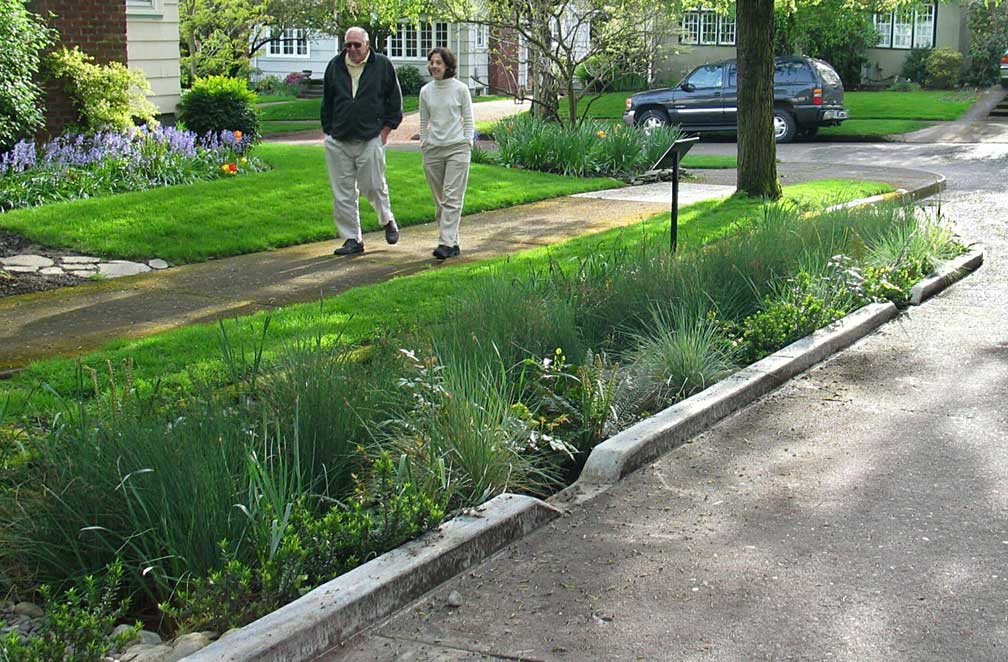
SEA Streets - Case Study
Left: existing condition. Right: Completed project. Photos: Austin, 2011
The Street Edge Alternatives project is a City of Seattle demonstration and prototype intended to document the effectiveness and costs of using an ecological infrastructure in contrast to conventional storm sewer approaches.
The image above left shows the existing condition. The paved area and the right-of-way is very wide. This is amplified by the ample building setback requirement.
The second image illustrates the new narrowed street with its curvilinear alignment. Notice that the sidewalks are narrow but that there is no curb. The combined width of the road and walks allows fire vehicles to access in an emergency.
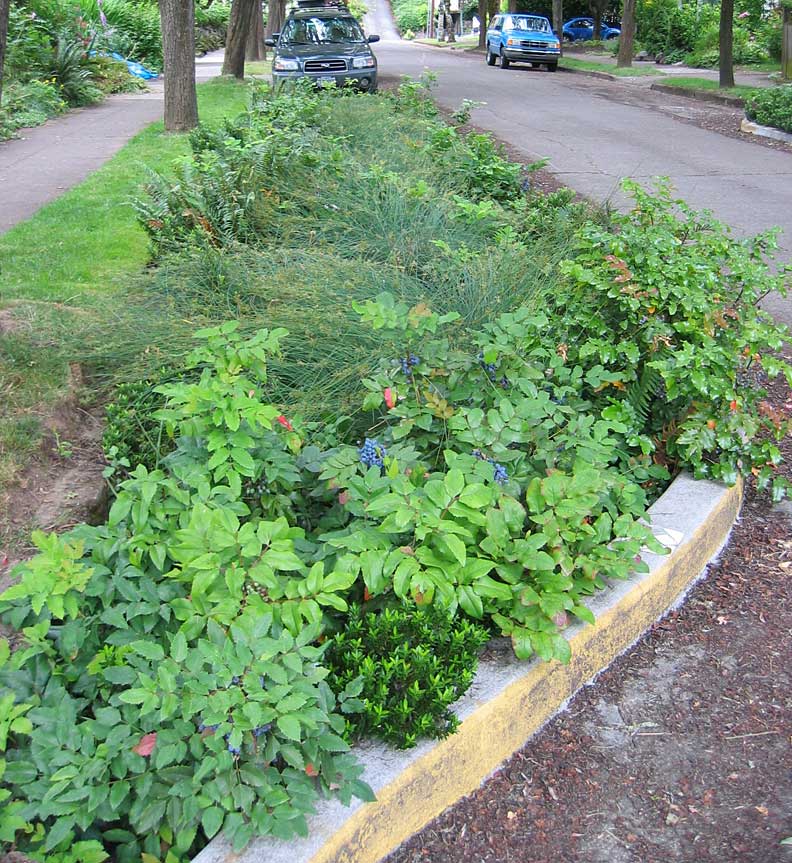
Left: A SEA Street just after planting. Right: The project with mature plantings.
The image at left, top, shows the finished project just after construction was completed. Enlarge to image to see the depth and extent of the infiltration areas, since these are obscured in the images that show mature vegetation.
In the second image notice that on this block there is a sidewalk on only one side of the street. The street sheet flows to the right where the swales and infiltration beds are placed. This changes the conventional practice of crowning a road and draining to a curb, gutter and catch basin. Sheet flow grading responds particularly well to sloping sites.
Site Accommodations
Retaining walls are required where the steepest parcels meet the road. Photo: Austin, 2011
When residential lots slope steeply toward the street, then retaining walls or steepened slope are required to create the space needed for the swales and infiltration beds.
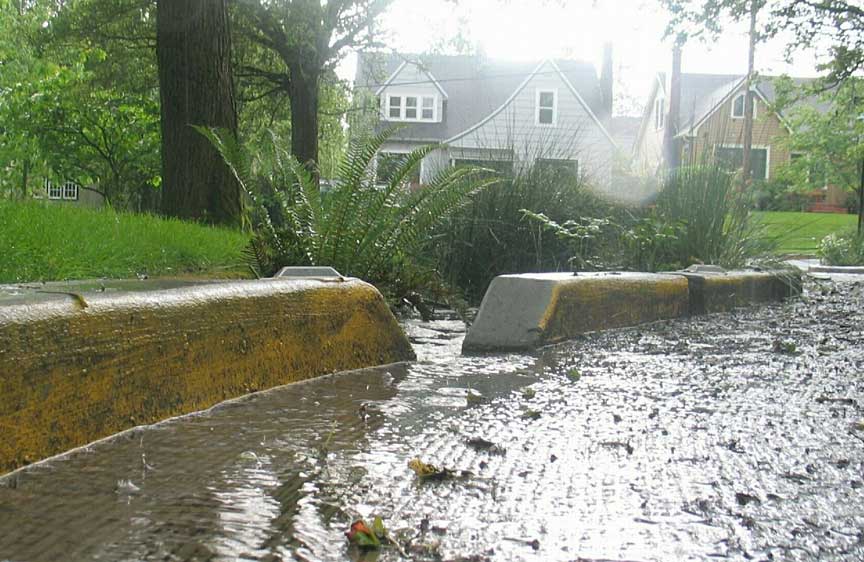
Longitudinal Slopes
Drop structures with weirs . Photo: Austin, 2011
Along streets that are very steep the bed of the infiltration swale must be made more level to reduce velocity, encourage infiltration, and improve water quality. Drop structures are used to make periodic vertical changes in elevation. In the image above, notice the trapezoidal notch in the concrete drop structure. This is a weir. It allows for low flows and permits easy measurement of the gallons per minute (or cubic feet per second) flowing through the weir.
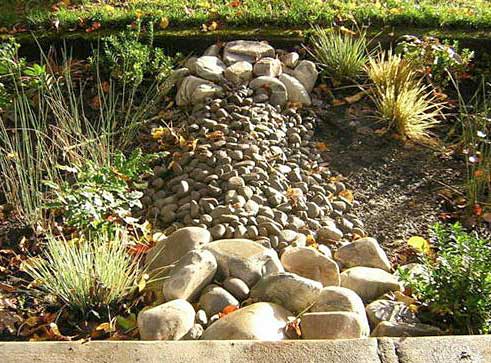
Hardened Plunge Pool
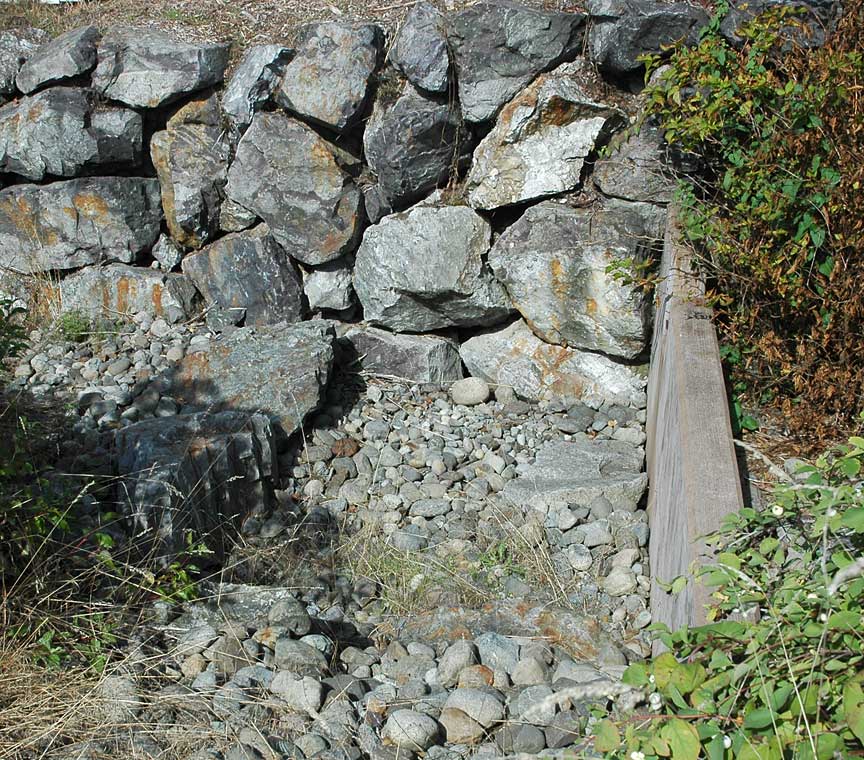
Plunge pool below weir. Photo: Austin, 2011
This image shows the plunge pool below the drop structure. The deepened and rock lined pool dissipates the energy in the water and prevents erosion.
The SEA Streets project was enormously successful. It improved water quality and reduced the total volume of stormwater leaving the neighborhood by 99 percent. This reduction has the important benefits of reducing downstream channelization and sedimentation that impacts the local salmon stream. The SEA street completely solved the problem of historic basement flooding in the adjacent residences.
This holistic approach is not only to be better for the environment, but is also less expensive than conventional piped stormwater drainage systems.
Low Impact Development
Suite of stormwater tools for use in low impact development.
Low impact development is the phrase applied to development that controls runoff and other development impacts on the parcel rather than in neighborhood or municipal scale measures, such as detention basins. Some of the principles of this approach are listed below.
-
Implement natural drainage including a natural drainage system at various levels of the development so that it can mimic nature.
-
Use bioswales along street edges to slow, filter, and infiltrate stormwater.
-
Utilize smaller block scale features such as rain gardens, disconnected downspouts, roof gardens, multi-functional open spaces that act as infiltration and storage areas, and grass swales.
-
Plant a lot of trees
-
Implement the low impact development in ways that work with site specific concerns, like snow storage, to minimize maintenance and ensure performance.
Portland Case Study - NE Siskiyou Green Street
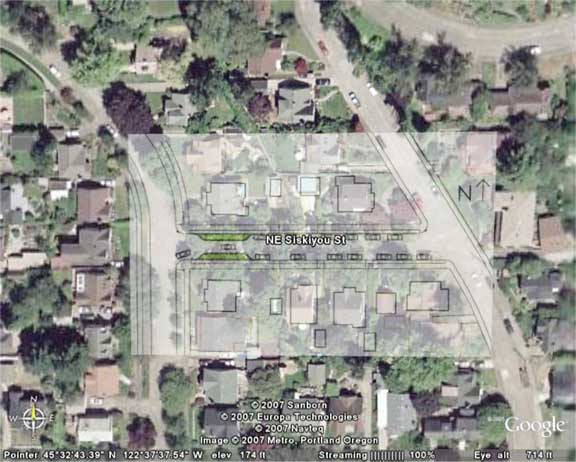
Aerial view of site (Snell, 2007)
The Siskiyou street demonstration project was constructed by the city of Portland, Oregon and consists of a pair of stormwater curb extensions that retrofit an existing residential street. Located on NE Siskiyou Street between 35th Place & 36th Avenue in Portland, the landscaped curb extensions are within the parking zones on each side of the street just above storm drain inlets.
This well documented project designed by Kevin Perry, ASLA was installed in October, 2003. Total project cost, including management, design, and construction was $20,000 of which $3,000 is attributed to ancillary street and sidewalk repairs costs. These would not be needed for similar projects or new construction. Total cost for the stormwater curb extensions was $17,000 or $1.83 per square foot of impervious area managed.
Catchment Area
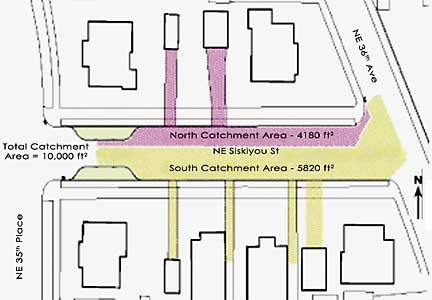
The plan view of the paved areas of the project area.
The curb extensions converted approximately 590 square feet of pavement to landscape. The size of the catchment is a little over 9,000 square feet and was considered fairly representative of conditions in the surrounding neighborhood. The infiltration area is approximately 5% of the drainage area, while the City of Portland’s 2004 Stormwater Management Manual (SWMM) specifies 6% for surface infiltration.
The configuration of the local combined sewer allowed for placement of a flow monitor. There is also a rain gage near the project. The project is maintained by neighborhood residents. Cities like Portland that have some combined sanitary and storm sewers are motivated to remove the stormwater runoff from the combined sewer since the stormwater causes the wastewater treatment plants to overflow during large storms. This causes inadequately treated sewage to be discharged into the local river causing environmental and human health hazards, not to mention the EPA fines for violations of the discharge permits.
Basin Location
Design area. (Snell, 2007)
The city traffic engineers considered the low-traffic residential setting to be ideal for a demonstration project. The street is 28 feet wide with a longitudinal slope of 2%. The addition of two 7-foot wide curb extensions created an acceptable lane configuration at the street intersection. Water lines were the only subsurface utilities within the project area and did not present obstacles. The project did not eliminate on-street parking. Adjacent property owners can park in front of their houses on SE 35th Place.
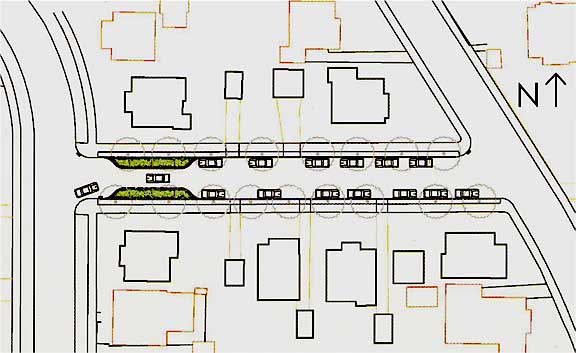
Landscaped curb extensions help filter pollutants from stormwater runoff, reduce stormwater flow, recharge ground water, and increase the aesthetic appeal of the streetscape. The image above is the simple plan for the infiltration area. The four bays trap sediment and provide time for the water to percolate into the soil.
The plans and asphalt cut line show the project dimensions and setting.
In the plan view (top left), water enters the infiltration area at curb cut locations and is retained with check dams. Any water that does not soak into the ground will then overflow at curb cuts at the end of the basin. In this project the space available for the curb extensions – length of curb unbroken by driveways or near a fire hydrant – was considered representative of conditions in other areas.
Check dams slow the flow of water and promote the infiltration of stormwater.
(Snell, 2007) Check Dam)
Plants such as rushes, sedges, and Oregon grape “green” the neighborhood while providing direct stormwater benefits.
System Performance
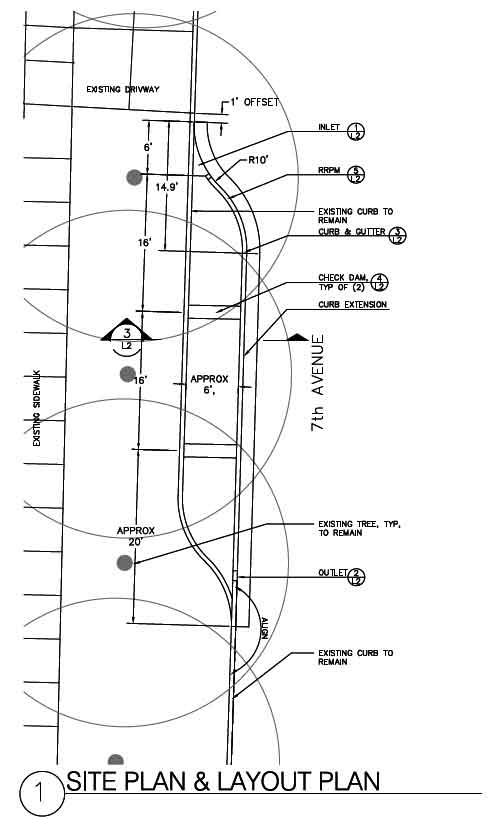
Left: Cross section through the infiltration basin. Right: Infiltration rates for various soil textures.
The section, above left, shows the construction requirements of the infiltration bed. Notice the maximum depth of the water stored.
Soil infiltration rate is a critical issue but in this case an infiltration test was not required before construction. Adequate documentation of the characteristics of the local soils already existed. The Natural Resources Conservation Service (NRCS) soil survey for Multnomah County classifies the soils as 51A-Urban Land and well-drained Multnomah soils. The surface horizon typically is dark brown silt loam about 25” thick. Soil below this depth is gravelly silt loam and gravelly sand to a depth of approximately 60”.
The second image above is a table that shows the infiltration rates for various soil types.
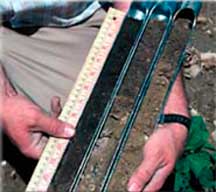
(Snell, 2007) Soil profiles showing texture and horizons)
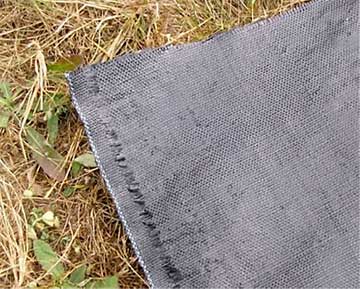
Geotextile Fabric. Photo: A. Snell, 2007.
The image above shows a geotextile fabric. It is used to separate soil types. In this project it was placed on top of the existing subgrade to prevent the permeable backfill from sinking into the natural soil. This practice is no longer recommended since clay particles can migrate to the geotextile fabric and clog the openings. This dramatically slows the infiltration into the subsoil.
The image below shows the curb extension on the north side of the street. The two curb inlets are shown and the excavation is complete.
(Snell, 2007)
Completed Project
View of the completed project, looking west (Snell, 2007)
After installation, use and analysis the performance of the infiltration beds can be assessed.
The physical volume of the infiltration basin is large enough to store the initial peak of the 25-Year storm without infiltration. That translates into a minimum 60% reduction in peak flow, and would provide flooding protection for the majority of the local basements regardless of the infiltration rate.
The combination of the facility volume and infiltration into the subsoil was sufficient to capture a vast majority of each design storm. Infiltration rates at this facility were excellent, even during saturated conditions.
(Snell, 2007) 25 year storm simulation test
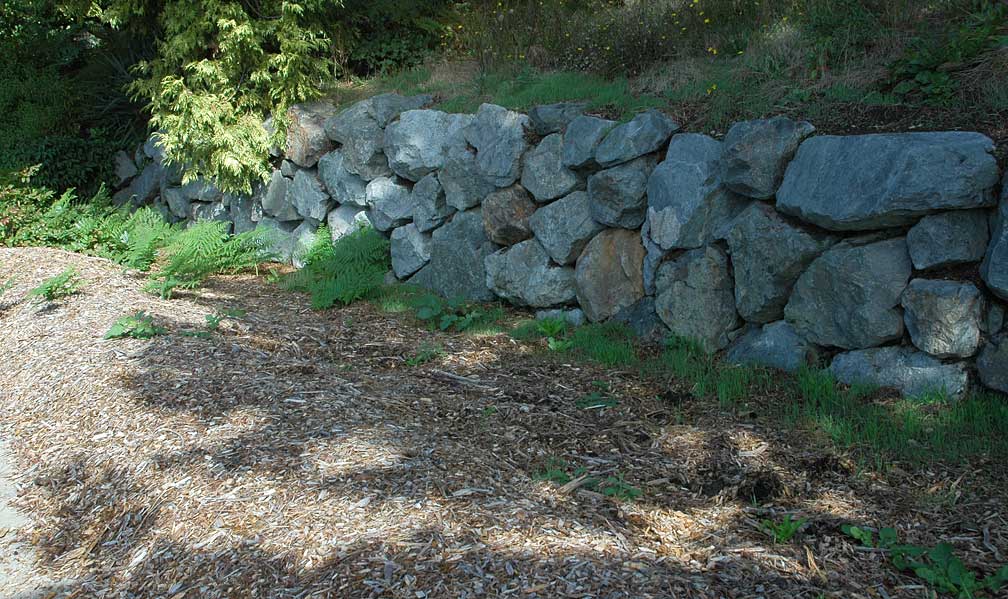
Some interior check dams were eroded by the highest flow rates and required repair after the initial tests. A new check dam design is recommended to reduce maintenance. A rock clad check dam is shown below. An improvement to the constructed system includes an outlet dam or weir incorporated into each basin to maximize the retention volume.
Lessons
The lush vegetation of the infiltration basin.
The data shows that the curb extensions on Siskiyou are capturing and infiltrating a large proportion of the runoff that drains to them.
The plants grew vigorously during the first year and little weeding was required.
During the first year, the vegetated fore bays filled twice with sediment and debris (to a depth of 4-6 inches). City staff removed the sediment by hand with a shovel and rakes. The sediment removal typically required 30 minutes per fore-bay.
Although planted infiltration basins like this one are usually built for water quality improvement this example demonstrates significant stormwater rate and volume reductions.
Glencoe Elementary School
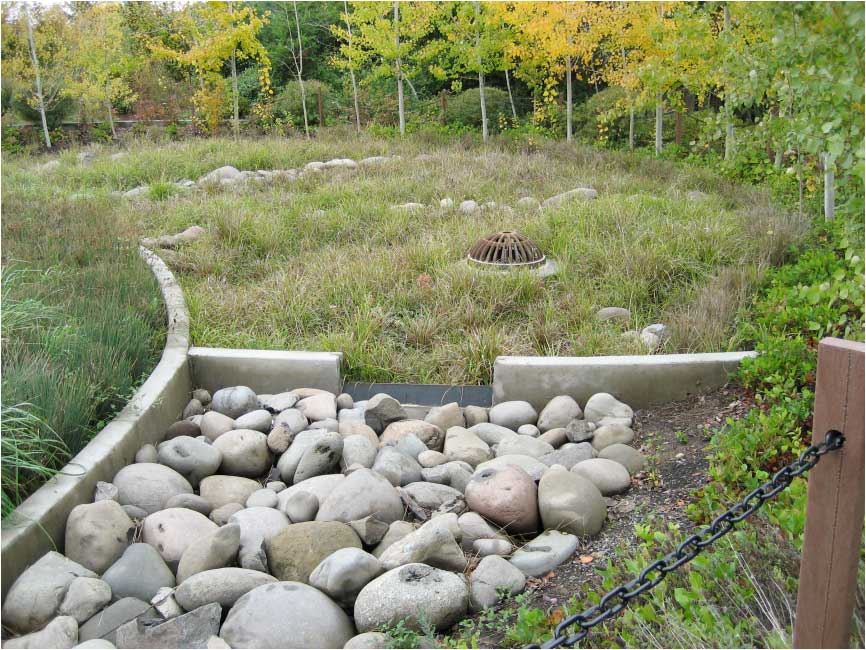
Left: the sedimentation area of the infiltration basin is shown in the foreground. Right:
Infiltration or bioretention is the permanent capture of a volume of water within a planted bed. These systems reduce the total amount of water that runs off the site, as illustrated in by the Siskiyou project above. This is in contrast to detention systems that only slow the rate at which water runs off.
The image at upper left is at the Glencoe Elementary School, SE Belmont, Portland, OR. In the image foreground there is a cobble inlet that serves to direct water from two streets into the garden. The cobble area serves as a sediment trap. The next sections store water. An overflow is shown to accept water above the design storm. However, enough water is infiltrated and stored to slow runoff which reduces downstream damage. There is no permanent pond (wet pond) in this case.
The image, above right, shows a bioswale that receives the runoff from the school parking lot. The bioswale traps sediment and conducts the water to the infiltration garden. The swale is intended to clean the water but logs across the swale also retain some water. Often a sequence of bioswales, retention and detention measures make up a stormwater management plan.
In the image below you can see the shallow ponding in the project during a storm and just after the project was planted.
(www.werf.org)

Case Study: Portland State University
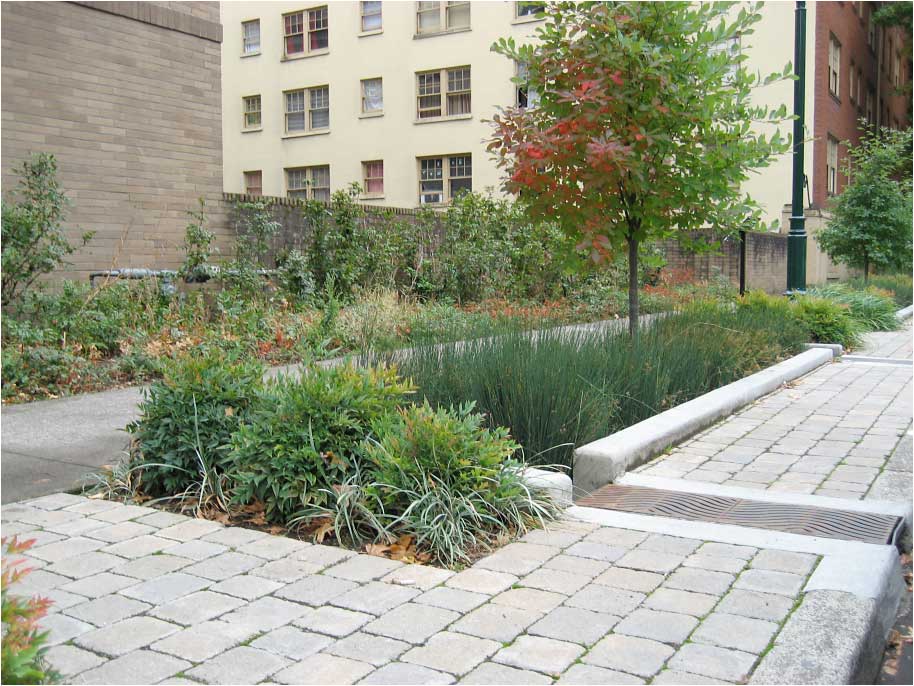
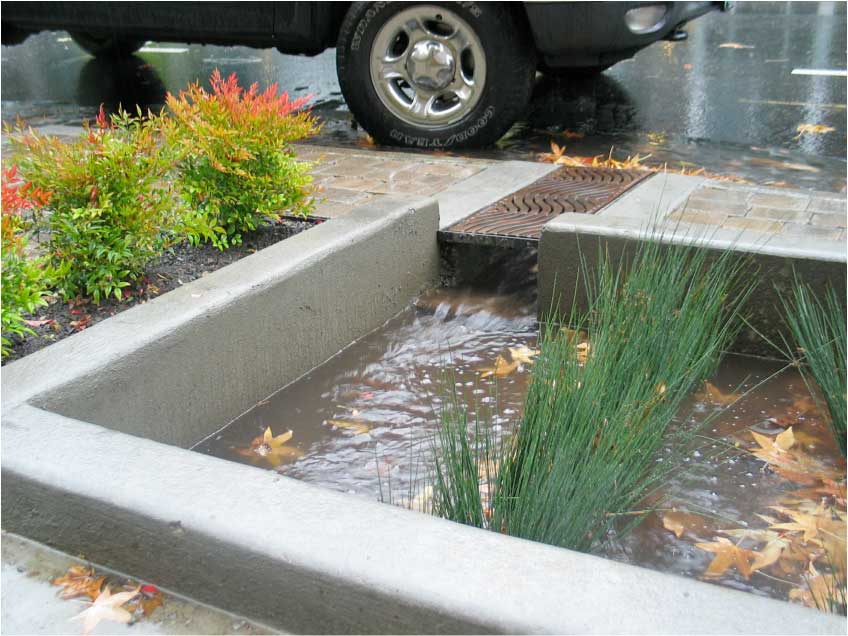
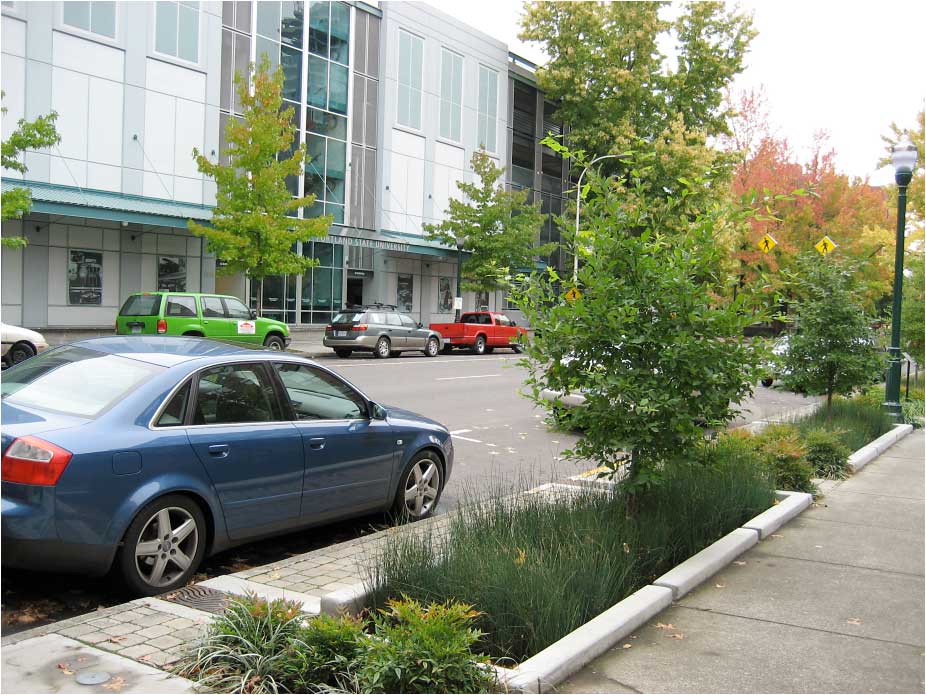
The first three images show the curbside infiltration beds. The last image shows a series of linked infiltration beds between campus buildings.
The Portland State University project takes a slightly different approach with a more urban character. Notice in these images that curb cuts allow water to flow into long narrow infiltration beds. The planted beds are set back from the curb to allow passengers in parked cars to exit without stepping into the plantings.
The planting are architectural in character and there are few species. Both of these features are consistent with the urban context of the project. Notice in the third image that curb cuts also drain water from the sidewalk into the planted beds.
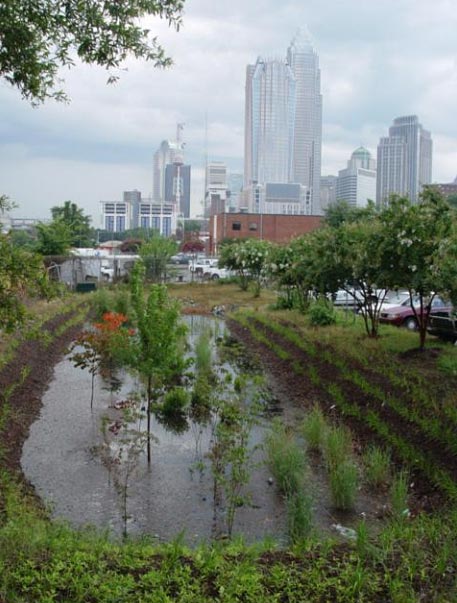
Water Quality Improvement with Bioretention Basins
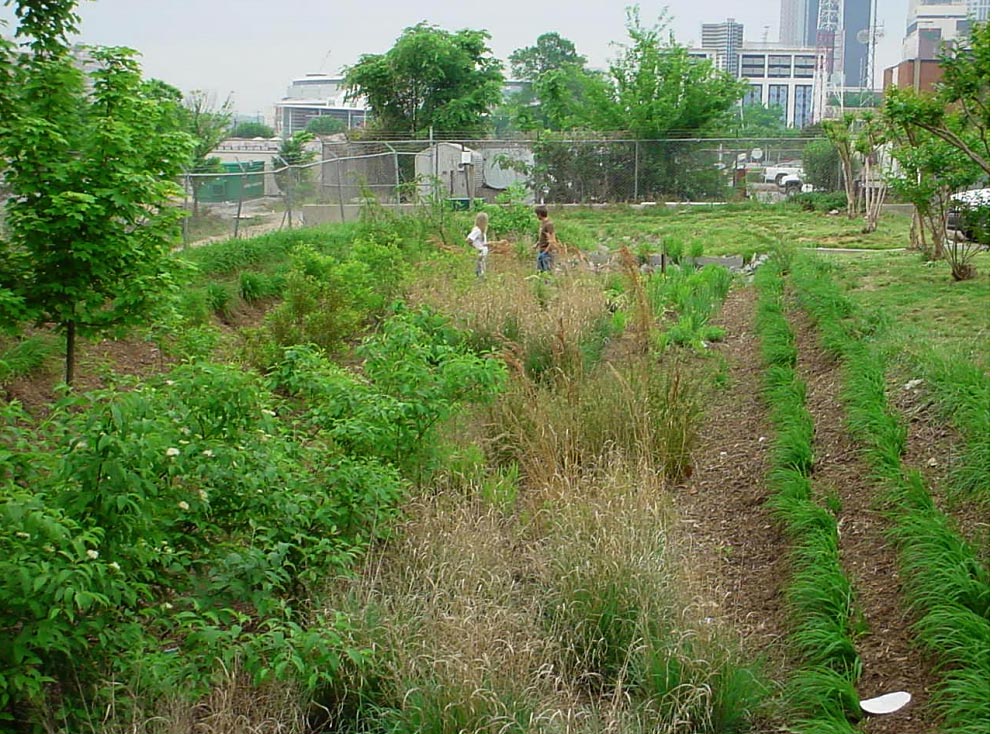
The planted infiltration basins (also called bioretention basins or rain gardens) are designed based on experience with vertical subsurface flow constructed wetlands pioneered in Europe for treatment of wastewater. We will consider the treatment capacity of vertical subsurface flow wetlands in another tutorial. However, bioretention basins differ by having a sandy soil and only intermittent flooding. The bioretention bed shown above was constructed to treat 1” of rainfall. The bioretention cell receives water from a .92 acres parking lot. The surface of the infiltration bed is 2,480 ft.² and composed of a 4’ depth of loamy sand (silt/clay = 5.7%) with a 6" diameter corrugated under drain. The soil permeability is .43 in/hr and the basin is planted with a variety of water tolerant species. For storms of less than 1.65’’ of rainfall the bioretention cell decreased peak storm outflow dramatically (96% for storms less than 40 mm) (Hunt, 2008).
The bioretention bed performed very well (see table below), although the low total nitrogen removal was due to low organic matter in the runoff. The increase in nitrite and nitrate indicates that the bed provides aerobic (oxygen rich) conditions for the conversion of ammonium to nitrite and nitrate but that there is no oxygen depleted zone in the basin (and probably too little carbon) to denitrify the nitrates. We will consider how to improve the removal of nitrates in a later tutorial.
| Pollutant | Removal | Pollutant | Removal | |
| Total Nitrogen | 32% |
Fecal Coliform Bacteria |
69% |
|
| Total Kjeldahl Nitrogen | 44% |
E. coli |
71% |
|
| Ammonium | 73% |
Zinc |
77% |
|
| Nitrite and Nitrate | -5% |
Copper |
54% |
|
| Total Suspended Solids | 60% |
Lead |
31% |
|
| Biological Oxygen Demand | 63% |
Iron |
330% |
|
| Total Phosphorus | 31% |
(Hunt, 2008)
Study Questions
What is the rainfall depth for the 2-year, 24-hour storm in Moscow?
What is the 95th percentile for rainfall depth in Moscow, Idaho?
What is the range for percent clay in the silt loam soil type?
True/False Very coarse sand is 2-1 mm in size.
True/False The Seattle SEA streets project features a side walk on only one side of a narrow street, sheet flow to a curb and gutter and curb cuts draining water into a wet pond.
The Seattle SEA streets project reduced the volume of stormwater leaving the neighborhood by _____ percent.
List two "low impact design" principles.
At Siskiyou street demonstration project the area of infiltration beds were _______ percentage of the catchment area.
What is the short and long term infiltration rate for loam soil?
What design storm volume can the Siskiyou project hold without infiltration?
What design element should be modified to reduce maintenance in the Siskiyou project?
True/False The outlet of the project should be modified to include a weir to increase storage in the Siskiyou project.
How do bioretention basins differ from vertical subsurface flow wetlands?
The bioretention basin in Charlotte, North Carolina demonstrated a very high capacity to remove ammonium and zinc. What were the removal percentages for these two elements?
References:
W. F. Hunt; J. T. Smith; S. J. Jadlocki; J. M. Hathaway; and P. R. Eubanks. Pollutant Removal and Peak Flow Mitigation by a Bioretention Cell in Urban Charlotte, N.C. 2008
Sushban Shrestha, Xing Fang, and Junqi Li. Mapping the 95th Percentile Daily Rainfall in the Contiguous U.S. World Environmental and Water Resources Congress 2013 © ASCE 2013