 An existing freeway has the following characteristics:
We are interested in determining the existing LOS and density as well as the maximum service flow rate at capacity (LOS E) for a two-mile section of this freeway with a grade of +4% [Solution Shown Below]
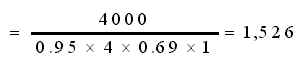
Solution In order to determine the existing LOS using the applicable graph or table, we need to calculate (1) the service flow rate and (2) the adjusted free-flow speed. 1. The service (or passenger-car equivalent) flow rate calculation is as follows: 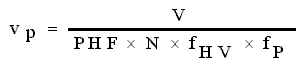
V = hourly peak hour volume (vph) = 4,000
fp = driver population factor = 1.0 (assumed) 2. The free-flow speed calculation is as follows: FFS = 70 – fLW – fLC – fN - fID Where We then draw the free-flow speed curve of 68.1 mph on the graph as shown below. 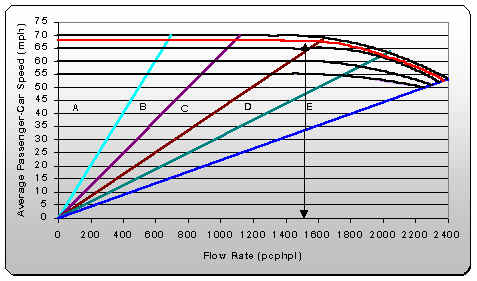
At the flow rate of 1526 pcphpl, the LOS is C. Density is calculated as: D = vp/S Where The flow at capacity can be taken from the graph above, at the end of the red line as 2380 pcphpl.
|