 The following excerpt is taken from Chapter 5 (pg. 6 ) of the Transportation Research Board Special Report on Traffic Flow Theory, published on the website http://www.tfhrc.gov/its/tft/tft.htm. Consider a single-lane queue at the beginning of the effective green at a signalized intersection. If the number of cars in the queue (i.e., the queue size) at this time is x and the average space headway is h, then the estimated queue length (i.e., the space occupied by the x cars) is xh. Suppose now that shortly after the beginning of green, N1 cars join the queue while N are discharged in front. Then following the same logic, the queue length should be [x + (N1-N2)]h. However, generally this is not the case, since shortly after the commencement of green the queue length is growing regardless of the net difference N1 – N2; for instance, if N1 = N2 the effective queue size continues to be x, but the queue length can no longer be estimated from the product xh. Clearly the average space headway is a function of time because of compressibility (i.e., the changing density within the queue in both time and space). This observation leads to the conclusion that although input-output analysis can be used for describing the evolution of queuing situation in time, they yield crude estimation of another important state variable (i.e., the queue length). For fixed-time control such approximations may suffice, but when further accuracy or realism is required, more rigorous modeling is necessary. Another disadvantage of input-output analysis is that the assumption of compact queues leads to miscalculations of the queue size itself and therefore results in miscalculations of delays (Michalopoulos and Pisharody 1981). The simple continuum model offers the advantage of taking compressibility into account ¼ (pp. 9-11) A major benefit of the continuum modeling is the fact that compressibility is built into the state equations since speed or flow is assumed to be a function of density. This suggests that as groups of cars enter areas of higher density, the continuum models exhibit platoon compression characteristics; conversely, when they enter areas of lower density we observe diffusion or dispersion. This phenomenon has been shown analytically in Michalopoulos and Pisharody (1980), where it is demonstrated that by using continuum models we do not have to rely on empirical dispersion models such as the ones employed today in most signal control packages. The result is a more realistic and elegant modeling that should lead to more effective control. The advantage of the analytical results presented thus far is that they visually depict the effects of downstream disturbances on upstream flow. Thus they provide a good insight on the formation and dissipation of queues and congestion in time and space in both freeways and arterials; further, they can be used to demonstrate that platoon dispersion and compression are inherent in this modeling. . . . The disadvantage of the analytical solution lies in the oversimplifications needed in the derivations. These include simple initial flow conditions, as well as arrival and departure patterns, absence of sinks or sources, and uncomplicated flow-concentration relationships. Most importantly, complexities frequently encountered in real situations such as turning lanes, side streets, or freeway entrances and exits cannot be treated analytically with ease. As in similar problems of compressible flow, these difficulties can be resolved by developing numerical solutions for the state equations. Clearly, a numerical methodology is needed for numerical implementation of the conservation equation in practical situations. This allows for inclusion of complexities one is likely to encounter in practice (turning lanes, sinks and sources, spillbacks, etc.) treatment of realistic arrival and departure patterns, more complicated u-k models, as well as inclusion of empirical considerations. Numerical computation of k, u, and q proceeds by discretizing the roadway under consideration into small increments Dx (in the order of 9 to 45 meters) and updating the values of these traffic flow variables on each node of the discretized network at consecutive time increments Dt (in the order of one second or so). . . . . . . It should be emphasized that this discretization is not physical and is only performed for computational purposes. . . . density on any node j except the boundary ones . . . at the next time step n+1 is computed from density in the immediately adjacent cells (both upstream and downstream j-1 and j+1 respectively) at the current time step n according to the relationship:
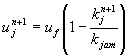
in which: Once the density is determined, the speed at t+Dt (i.e., at n+1) is obtained from the equilibrium speed density relationship ue(k), i.e.,
For instance, for the Greenshields (1934) linear model,
where uf is the free flow speed and kjam the jam density. ¼ if an analytical expression is not available, then u can easily be obtained numerically from the u-k curve. Finally, flow at t+Dt is obtained from the fundamental relationship:
. . . It can be demonstrated (Michalopoulos 1988) that measures of effectiveness such as delays, stops, total travel, etc., can be derived from k, u, and q. . . . In conclusion it is noted that more accurate numerical methods can be developed for solving the conservation Equation 9; such methods are not recommended as they lead to sharp shocks which are unrealizable in practice. . . .
|