

|

Traffic Assignment
Assign the vehicle trips shown in the following O-D trip table to the network, using
the all-or-nothing assignment technique. To summarize your results, list all of the links
in the network and their corresponding traffic volume after loading.
Origin-Destination Trip Table:
| |
Trips between Zones |
From/to |
1 |
2 |
3 |
4 |
5 |
1 |
- |
100 |
100 |
200 |
150 |
2 |
400 |
- |
200 |
100 |
500 |
3 |
200 |
100 |
- |
100 |
150 |
4 |
250 |
150 |
300 |
- |
400 |
5 |
200 |
100 |
50 |
350 |
- |
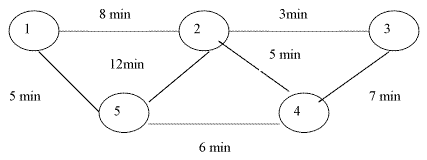
Highway Network:

[Solution Shown Below]
Solution
The all-or-nothing technique simply assumes that all of the traffic between a
particular origin and destination will take the shortest path (with respect to time). For
example, all of the 200 vehicles that travel between nodes 1 and 4 will travel via nodes
1-5-4. The tables shown below indicate the routes that were selected for loading as well
as the total traffic volume for each link in the system after all of the links were
loaded.
Nodes |
|
Link |
Travel |
|
From |
To |
Path |
Time |
Volume |
1 |
2 |
1-2 |
8 |
100 |
|
3 |
1-2,2-3 |
11 |
100 |
4 |
1-5,5-4 |
11 |
200 |
5 |
1-5 |
5 |
150 |
2 |
1 |
2-1 |
8 |
400 |
|
3 |
2-3 |
3 |
200 |
4 |
2-4 |
5 |
100 |
5 |
2-4,4-5 |
11 |
500 |
3 |
1 |
3-2,2-1 |
11 |
200 |
|
2 |
3-2 |
3 |
100 |
4 |
3-4 |
7 |
100 |
5 |
3-4,4-5 |
13 |
150 |
4 |
1 |
4-5,5-1 |
11 |
250 |
|
2 |
4-2 |
5 |
150 |
3 |
4-3 |
7 |
300 |
5 |
4-5 |
6 |
400 |
5 |
1 |
5-1 |
5 |
200 |
|
2 |
5-4,4-2 |
11 |
100 |
3 |
5-4,4-3 |
13 |
50 |
4 |
5-4 |
6 |
350 |
| |
Link |
Volume |
|
1-2 |
200 |
2-1 |
600 |
1-5 |
350 |
5-1 |
450 |
2-5 |
0 |
5-2 |
0 |
2-3 |
300 |
3-2 |
300 |
2-4 |
600 |
4-2 |
250 |
3-4 |
250 |
4-3 |
350 |
4-5 |
1300 |
5-4 |
700 |
|