Click to Select
Glossary
Excel Demonstration
Exit this Topic
Capacity and LOS: Theory and Concepts

 
Determining Level of Service and Density

Once you have made the appropriate adjustments to the free-flow speed and have calculated the equivalent passenger-car flow rate, determining LOS for a basic freeway section is as simple as looking at the table given in the module "Level of Service Criteria and Capacity", or at the graph below.

Graph of Average Speed versus Flow Rate with LOS divisions

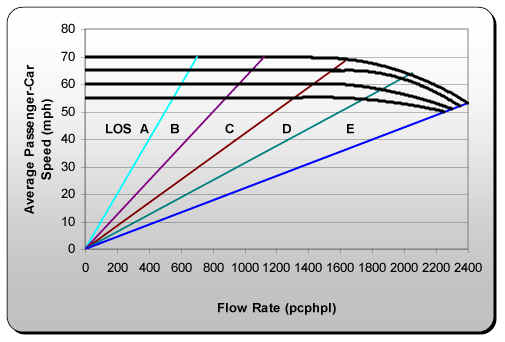
If your free-flow speed calculation resulted in a speed other than 70, 65, 60 or 55 mph, you would construct the appropriate curve on the graph below. The curve would have the same general shape as those shown and would intersect the y-axis at the estimated (or measured) free-flow speed. The red line in the figure below presents an example of a curve drawn for an estimated free-flow speed of 63 mph.

Graph of Average Speed versus Flow Rate

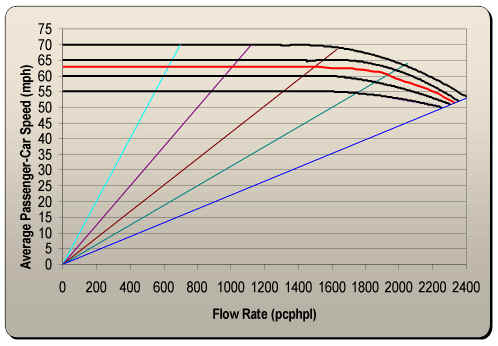
Vehicle density is calculated by the following equation:

D = vp/S

where
D = density (pc/mi/ln),
vp = flow rate (pcphpl), and
S = average passenger-car speed (mph).