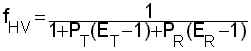
 Determining the adjustment factor for the presence of heavy vehicles is a two-step process: 1) Finding passenger-car equivalents for trucks, buses and recreational vehicles 2) Using the equivalent values and the percentage of each type to compute the adjustment factor, using the following equation:
where fHV = heavy-vehicle adjustment factorET = passenger-car equivalents for trucks and/or buses ER = passenger-car equivalents for recreational vehicles PT, PR = proportion of trucks or buses and RVs in the traffic stream. Finding ET and ER There are two methods for finding values of ET and ER and the choice of methods depends on the freeway grade conditions.Method 1: If an extended length of freeway contains a number of upgrades, downgrades and level segments, but no one grade is long enough or steep enough to have a significant impact on traffic operations, finding ET and ER is relatively straightforward. ET and ER are shown in the following table for extended general segments where no one grade equal to or greater than 3 percent is longer than 1/4 mile, or longer than 1/2 mile for grades less than 3 percent.
Method 2: There are three tables you can use to find ET and ER for isolated specific up and down grades:
These three tables are significantly larger than the one above and can be viewed and printed by clicking on the link below.
|
|||||||||||||||||