|
Measuring density with plots & quadrats
What is a Quadrat?
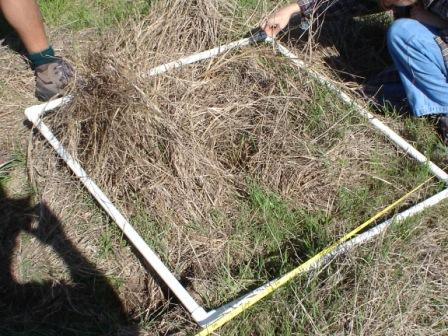 A quadrat
is typically a square frame constructed of plastic or pvc pipe, metal
rod, or wood that is
placed directly on top of the vegetation. Quadrats are also commonly called
"plots." A quadrat
is typically a square frame constructed of plastic or pvc pipe, metal
rod, or wood that is
placed directly on top of the vegetation. Quadrats are also commonly called
"plots."
Quadrats do not have to be square but their area must be known. Other
quadrat shapes commonly include circles and rectangles.
Square quadrats can be any size. Common sizes include: 25 by 25 cm, 50 by 50
cm,
1 by 1 m and similar sizes in feet. Quadrats are used in many different
scientific disciplines from vegetation assessment
to archeological investigations. Quadrats are required for estimating several
vegetation attributes including:
-
Density - for counting the number of objects within the unit area of
the quadrat.
-
Biomass - achieved by "clipping" all the material of a given type
(e.g., grass, shrub or forb) or species within a quadrat.
-
Cover - often accomplished by estimating the area of a quadrat that
is covered by a plant's canopy.
-
Frequency - the proportion of quadrats in which a species occurs is
called frequency, thus quadrats are required to estimate plant frequency.
Design of Quadrat-based Sampling
Four properties of a monitoring protocol are essential to consider before
starting a sampling protocol using quadrats (Bonham 1989). They are:
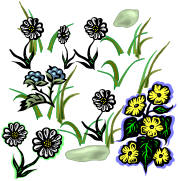
1. What is the distribution of the plants across the landscape
under assessment?
- Is the distribution of plants clumped and variable,
heterogeneous,
across the landscape?
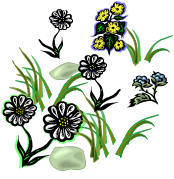
- Or, are plants rather evenly, homogeneously,
distributed across the landscape?
- Do the features of interest occur in linear strips, clumps, and what
average area does one individual occupy?
2. What size quadrat should be selected?
- In selecting an appropriate quadrat size, we need to ensure that the quadrats are
big enough to contain at least one plant of interest and should include enough
plants to get a good estimate of density.
- Conversely,
the quadrat needs to be small enough that the count can be conducted in a reasonable amount of time.
In other words, you don't want to measure hundreds of individuals per quadrat.
Rules of Thumb for Quadrat Size:
- A quadrat is too large if the 2 most abundant species are found in every
plot.
- A quadrat is too small if the most abundant species is not found in a
majority of the plots.
- If more than 5% of sampling units have none of the plants of
interest, increase the plot size.
Quadrat Size Depends on Plant Size:
- The larger the average sized plant the larger the necessary frame.
- A plot should be larger than the average-sized plant and larger than the
average space between plants.
- It is difficult to sample plants of different life forms (i.e., shrubs
and grasses) with the same plot frame. Therefore, nested techniques are
often used where shrubs are measured with one plot (e.g., a longbelt transect)
and herbaceous plants are measured with a separate, often smaller, plot.
- Select the size of quadrat based on species of greatest interest.
Perimeter to Area Ratio:
- The perimeter:area ratio decreases as plot size increases.
- If borderline decisions (i.e., is a plant in or out of plot) are
difficult to make, then select a plot size that reduces the perimeter:area ratio.
The Bottom Line:
- Sparse vegetation requires larger quadrats than dense
vegetation.
- Uniform vegetation requires fewer and smaller quadrats than
diverse and heterogeneously distributed vegetation.
3. What shape of quadrat should be
selected?
Many quadrat shapes exist for vegetation assessment -- from squares to
rectangles to circles.
Rectangle --
- More likely to cut across plants or clumps of plants rather than be
completely occupied by plants. So, generally best for "clumped" vegetation.
- Rarely completely occupied by bare spaces.
- Often have lower variance than squares or circles.
- Can reduce plot to plot variability in sparsely vegetated communities.
- Easier to estimate % cover than in circles or squares.
Elongated rectangles have often been shown to work effectively in ecological
studies (Bonham 1989; Elzinga et al. 2001), because vegetation frequently occurs
in clumps. Belt transects are rectangular in shape, where the "long" end is very
much longer than the short end. Belt transects, sometimes called strip
quadrates, differ from line transects as they have a
larger and specifically defined width. A line transect is a narrow line (< 1
inch wide) stretched across a plot and it is not a "quadrat" because it has no
area. Whereas a belt transect is several feet or meters wide and is a quadrat of
sorts.
Square --
- Greater perimeter:area ratio than circles but less than rectangles.
- Most typically used to estimate frequency because presence/absence is
easy to estimate.
- Squares are easier to estimate % cover than circles but not as easy as
rectangles.
Circle --
- Less perimeter (per area) than square or rectangle.
- Often used in clipping because perimeter decisions are difficult to make
when clipping.
- Reducing perimeter:area ratio is also good in communities with large
sod-forming plants.
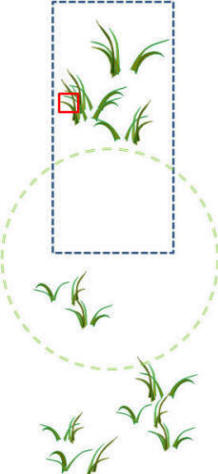
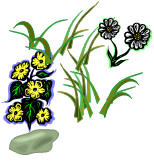
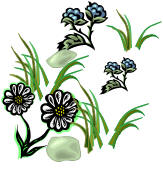
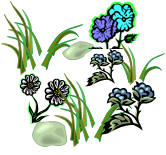
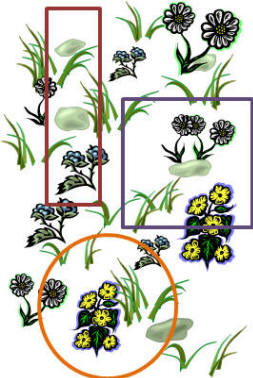
In the figure to the right, the red square would clearly be too small a quadrat
because it is too small to capture even a single individual.
Likewise, the green circle in this example although is big enough to capture >1
individual its shape is not optimal in capturing the density of these clumped
plants. In this example. the elongated rectangle is the most appropriate quadrat
as both a representative number are sampled and the shape captures the
typical arrangement of plants.
4. How many observations are needed to accurately estimate the
density of the species?
The
number of observations needed is determined by the sampling protocol. However, most studies seek to
have enough plots so that the standard error of the mean is about 10% or less. As variability in
plant community increases:
The Size-Variability Trade Off:
- Small quadrats (or plots) tend to have higher variability or express
greater differences from plot to plot.
- Small plots are usually faster to read.
- But, the number of plots you must examine depends on variability.
The more variation among plots, the more plots you need to estimate.
- Therefore, there is a trade-off between number needed and quadrat size.
Sources of
Uncertainty
 One of the main sources of error in quadrat based sampling occurs when
deciding whether an individual is within or outside the quadrat frame. These
types are errors are called "boundary decisions" and protocols
should be discussed to ensure consistent decisions (Elzinga et
al. 1998). For example, would you include a species that entered the quadrat
or just those species with roots in the quadrat. What then happens with
species that roots cross the quadrat but terminate outside it? Can you
achieve this assessment without damaging the plant? A further common source
of error is due to differences in observers opinion. Again this can be
minimized by having clear consistent standards. For more details on boarder
decision study figure above and text in Elzinga et al. 1998. One of the main sources of error in quadrat based sampling occurs when
deciding whether an individual is within or outside the quadrat frame. These
types are errors are called "boundary decisions" and protocols
should be discussed to ensure consistent decisions (Elzinga et
al. 1998). For example, would you include a species that entered the quadrat
or just those species with roots in the quadrat. What then happens with
species that roots cross the quadrat but terminate outside it? Can you
achieve this assessment without damaging the plant? A further common source
of error is due to differences in observers opinion. Again this can be
minimized by having clear consistent standards. For more details on boarder
decision study figure above and text in Elzinga et al. 1998.
|