Measuring Frequency
What is Frequency?
Frequency is the number of times a plant
species occurs in a given number of quadrats. Frequency is usually expressed as
a percentage and is sometimes called a Frequency Index. The concept of frequency
indicates the probability of finding a species in a
series of quadrats examined in an area of interest. No counting or measuring is
involved -- just a record of species present in each quadrat.
Use of Frequency Data
Frequency is most often used to compare plant
communities and to detect changes in vegetation composition over time. In
this way frequency can be used to assess vegetation trend.
Frequency is also used to quantify and describe the
distribution of a species in a community. If a scientist or land owner
examines quadrats across a landscape, the proportion of plots that contain a
plant of interest give an indication of how widely distributed that plant species is
across that landscape.
For example, if I were to examine 450 quadrat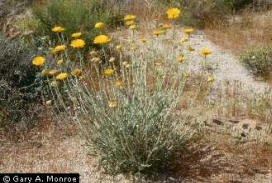 s
across
a shrublands site in the Chihuahuan desert and I found desert marigold (Baileya
multiradiata) in 54 of the quadrats, then my frequency would be 12%. s
across
a shrublands site in the Chihuahuan desert and I found desert marigold (Baileya
multiradiata) in 54 of the quadrats, then my frequency would be 12%.
54 quadrats ÷ 450 quadrats examined = .12 or
12%.
I would furthermore conclude that desert marigold occurs on the site
but it is not common or widely spread across the site.
Frequency is used to describe the abundance of a
species of interest but, it should not
not be used to
compare abundance of difference species. For example, if you are using a
50x50 cm quadrat and you find lupine has a frequency of 45% and the frequency
of tarbush is 20% you cannot conclude there is more lupine than tarbush. These
are very different kinds of plants and the size of quadrat you use will affect
how often the plant is recorded "in" the quadrat. If you want to compare
different species consider using cover or biomass (to be discussed in future
modules).
Frequency depends on Plot Size
Remember, frequency is the proportion of times a plant
occurred in the quadrats you examine. Suppose you.jpg) examined a plant
community the determine the abundance of Blackeyed Susan (Rudbeckia
hirsuta) using 100 quadrats that are 25 cm2 in
size.
If
you found that Blackeyed Susan occurred in 15 of the 100 plots you examined than the frequency of
this plant is 15%. Now, lets say you decide to repeat your examination with a large quadrat,
for example 1 m2. You can imagine that Blackeyed Susan may occur more
frequently in these larger plots thus the frequency would appear to be greater
even if the plants did not change on the environment. The bigger the plot, the more likely a plant is to occur in
the plot. examined a plant
community the determine the abundance of Blackeyed Susan (Rudbeckia
hirsuta) using 100 quadrats that are 25 cm2 in
size.
If
you found that Blackeyed Susan occurred in 15 of the 100 plots you examined than the frequency of
this plant is 15%. Now, lets say you decide to repeat your examination with a large quadrat,
for example 1 m2. You can imagine that Blackeyed Susan may occur more
frequently in these larger plots thus the frequency would appear to be greater
even if the plants did not change on the environment. The bigger the plot, the more likely a plant is to occur in
the plot.
For Example, examine this plant community examined with
a small quadrat.
Encounter Yellow Daisy 1 time in 10 plots or Frequency = 10%
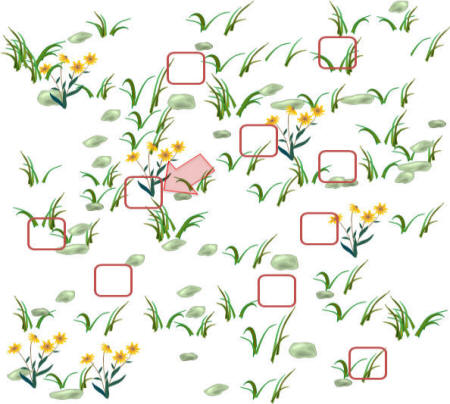 |
Same plant community, Larger Plot
Encounter Yellow Daisy 3 time in 10 plots or Frequency = 30%
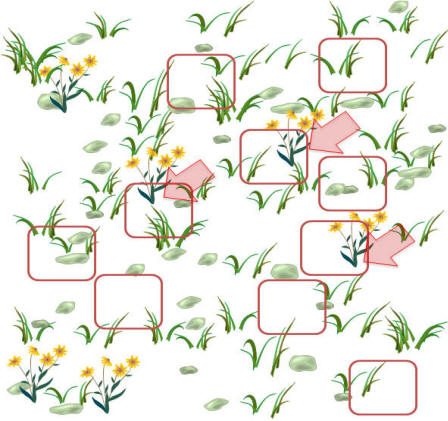 |
Advantages of Assessing Frequency
Frequency is widely used among land management
agencies such as the US Forest Service, Bureau of Land Management, and US Park Service to
monitor change in vegetation communities. From a monitoring perspective,
frequency is often the measurement of choice, because frequency is:
-
Highly repeatable. Individual
observers may disagree on how many plants occur, or how much they weigh, or
how much area they cover. But, it is easy to determine and agree if a
species occurs in a plot or not.
-
Fast and easy to measure. Little equipment is
required and no fancy protocols are needed.
-
Frequency of
perennial plants is
less
sensitive to seasonal changes or year to year variation. Plus,
ecological forces such as fire or grazing will probably affect amount of a
plant that remains, but, they will likely not affect the presence or
absence of a perennial plant.
-
Can describe distribution of species in a
community or across a landscape.
-
Highly sensitive to changes resulting from
seedling establishment, so it can be an early indication of community change
or invasion by
annual plants.
Limitations of Assessing Frequency
Despite its wide use in grasslands, shrublands,
woodlands, deserts, and forests there are several shortcomings
to using frequency that must be
considered when designing monitoring protocols.
-
Frequency is highly influenced by the size and
shape of the quadrat used. It may be difficult to determine the
"right" quadrat size for assessment and the "right" quadrat size may change
as the abundance of the plant changes over time.
-
If frequency changes, it is not clear which
vegetation parameter has changed: Cover? Density? Distribution across the landscape?
Or, changing abundance in a small area?
-
The key to good frequency data is
excellent plant identification skills. This is easier said than done. Either a
well-experienced observer is needed or many hours must be initially spent to
ensure good identification of plants.
|