|
measuring Biomass
Estimating Biomass
It takes a lot of time to clip many plots to make good estimates of biomass.
However, with a little training most field technicians can become skilled in
estimating the amount of biomass in a plot.
- To accurately estimate the amount of phytomass in a plot, the observer
must spend time training.
- The training procedure basically entails weighing representative units
of a plant and establishing an “eye” for what 5-, 10-, or 15-grams etc., of
forage looks like.
- Estimating biomass is both visual and tactile. Good estimates
generally require looking at the plant or plot and then "feeling" it to
assess density.
This procedure of estimating biomass can be easily accomplished for small
herbaceous plants. It is more difficult to gain excellence in estimating shrubs
and trees but, it is possible. Consider this example below:
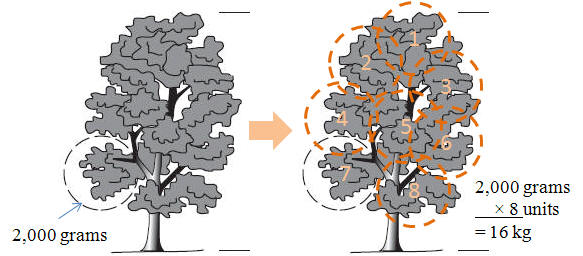
The Reference Unit Method is a slight
modification of the Direct Estimation Method
described above that is particularly well suited for shrubs. In this
method one simply clips a unit of the plant and carries it along to each plant
instead of learning to recognize a specific unit of weight:
-
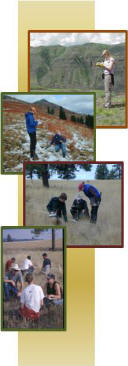
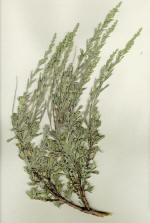 A
small unit of a plant (such as an average sized branch, see figure to right) is designated as the
reference unit and clipped from the plant. A
small unit of a plant (such as an average sized branch, see figure to right) is designated as the
reference unit and clipped from the plant.
- A reference unit should be 10-20% of the foliage weight of the average
plant.
- The reference unit is then held up against plants for which phytomass
estimates are required. The number of reference units in other individual plants
being examined is recorded.
- The weight of current season’s growth or total mass of the reference
unit is then determined.
- The weight of estimated plants = number of ref. units * wt of the ref.
unit.
- The techniques works well for some shrubs, but is not well suited for
compact, dense, unsegmented growth forms.
The accuracy of the observer’s estimate depends on:
- The experience of the observer. Well
trained technicians with a good deal of field experience can estimate the
amount of forage in a plot with little error.
- The alertness of the observer.
Accurate estimation requires significant concentration. Accuracy often
decreases at the end of the day when observers are tired, hot, or hungry.
- The vegetation type. Some plant
types are simply easier to estimate than others. For example, bunchgrasses
are often easier to estimate than sod-forming grasses.
Double Weight Sampling
Estimates of biomass can be calibrated by clipping a few plants or plots
after estimates are made. This procedure is called 'Double
Sampling' and basically requires that the field technician estimate
the weight of several plots and then clip a few plots to determine the accuracy
of estimates. Then, estimated weights can be adjusted to reflect clipped
weights.
For example, a comparison of estimated weights and clipped weights
might reveal that the observer consistently underestimates the weight of a
plot by 75%. Once this is known, the estimated weights can be adjusted to
reflect a more realistic and slightly higher amount of biomass per plot.
The advantage of double sampling is that it takes a lot less time to estimate
the weight in a plot than it does to clip it. Therefore, many more plots can be
examined in a landscape, pasture, or management unit.
How many plots should be clipped? In this technique many plots will be
estimated and several will be clipped. The number of plots to be clipped depends
primarily on the variation in phytomass from plot to plot and the accuracy of
the observer’s estimates. A good rule of thumb is to harvest at least 1 plot for
every 7 estimated. Further guidelines include:
- Clip enough quadrats so that some quadrats represent the least amount of
phytomass likely to be encountered on the site and some quadrats represent
the greatest amount of phytomass on the site.
- Each quadrat should be estimated first and then a random procedure
(e.g., a coin toss or random generator in a computer) should be used to
determine if the plot needs to be clipped. If this is not done, the observer
will tend to estimate the plots that need to be clipped more carefully than
those that are not going to be clipped.
- Ideally, the observer should never see the weight of the clipped plot or
the observer will adjust the weights of subsequent plots. In double sampling
methods, it is more important to be precise
and consistent than it is to be accurate.
However, the practice of predicting, clipping, then weighing does improve
the accuracy of an observers guesses over time.
- There is disagreement over whether an observer should try to estimate
dry weight or fresh weight in a plot. Generally, fresh weight is estimated
because it seems more relevant in the field. But, this requires
collecting field samples to weigh and correct estimates to dry weight.
Samples may even need to be collected throughout the day as plants become drier.
Adjusting estimated weights with double sampled
plots:
- A short-cut procedure based on the average difference between the
estimated and clipped plots, is given on pages 106-107 of the Interagency
Handbook,
Sampling
Vegetation Attributes
- The preferred procedure is to conduct a regression analysis. All plots
that were estimated and then clipped are used to create a regression line:
y= a+bx.
Where:
y is the clipped weight
of a plot
x is the estimated
weight of a plot
a is the y-axis intercept (a
constant that is added to each estimate)
b is the slope of the
regression line
● Computer calculation. Most computer
spreadsheet programs can develop a regression line.
● Hand calculation. The procedure for
calculating a regression line can be found in most basic statistics text
books.
● For information on how to calculate and use regression
models visit:
http://www.cnr.uidaho.edu/learn/statistics/lessons/lesson04/4_10.htm
- After a regression line is created, all of the estimated weights can
be adjusted to improve the accuracy of the guesses.
Once again, y= a+bx
with “y” being the adjusted weights and “x” the estimated
weights.
For example:
If your calculated regression line is: y = -20 + 1.5x
And, you estimated value (x) is 30 g/plot in the field
Then y = -20 + (1.5*30) or your adjusted estimate is 25 g/plot
- Express weights on a dry weight basis. The clipped weights and the
adjusted weights should then be put on a dry weight basis with the procedure
discussed in
lesson 7_3 under the
'clip-and-weigh' or 'harvest' method.
- Convert weights to meaningful units. When all weights are adjusted and
averaged the result will be phytomass in a small area. Guidelines for
converting plot weight to lbs/ac or kg/ha are located in
lesson 7_3.
|