The importance of interfacial deformation to the
quantitative understanding of an interacting drop (or bubble) and particle
is, perhaps, understated in previous chapters for the sake of emphasizing
other significant aspects. Thus, an entire chapter is dedicated to
the empirical and theoretical modeling of a spherical liquid-liquid interface
when acted upon by a rigid sphere via surface forces. Since the standard
atomic force microscope (AFM) is incapable of directly measuring the separation
between the probe and sample, the actual separation must be deconvoluted
from force vs. relative probe displacement data with the aid of theory
guided by experimental evidence.
In order to address the primary objectives of this
work, the evolution of the drop profile with changes in actual separation
from the impinging sphere is predicted from the Young-Laplace Equation.
Quantitative measurements between a droplet and a sphere with the AFM can
only be examined in the light of interaction theories if the distance separating
the liquid interface from the sphere is known, in this case indirectly.
Further consequences of a significantly deforming interface to be considered
are the changing geometry of interaction with force, or separation,
and the increased sensitivity to attractive forces leading to system instability.
The following theoretical considerations greatly reduce the separation
uncertainty and will be an important component of the dynamic force analysis
for attractive regimes to be discussed elsewhere.
Background
The theoretical model of a deformable sphere, i.e.
liquid drop, and rigid plate interacting in a liquid medium predicts a
separation limit when the surface pressure equals the internal pressure
of the dropthat is, when the internal pressure resists a repulsive surface
pressure1. For constant internal drop pressure, these
two surfaces cannot come closer than this critical separation. The
fluid interface deforms in constant compliance with the advancing plate
since the pressure applied to the intervening film cannot exceed the internal
drop pressure. The drop flattens to the surface of the plate without
contacting it; the surface area of the intervening film continues to increase
at constant thickness. Of course, the critical thickness may be nearly
the same as that for atomic separation (universal constant, ro
~ 0.16 nm), in which case the drop and plate will eventually touchby definition.
Miklavcic et al. submitted that similar conditions would be found for the rigid sphere and deforming droplet geometry consistent with an AFM experiment, but no such published work has become evident despite the fact that drops and bubbles have been the object of several AFM investigations recently2-10. The interfacial deformation due to a repulsively impinging sphere should still vary consistently with applied force, F, at large distances, Do, followed by a transition at close approach until the critical separation where the rate of change of force with decreasing separation rises to infinity for decreasing DP.
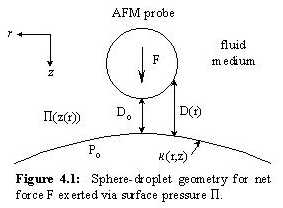
For simplicity and to easily compare results from Miklavcic and others1, 11-13, the situation of only electrostatic double-layer repulsion is first considered; but the derivations are consistent, in general, for surface forces of any nature. The Young-Laplace Equation (Eq. 4.1) relating interfacial curvature, k, to the pressure drop across the interface, DP, is simplified for axial symmetry where the local curvature (in brackets) is written in terms of drop height, z, as a function of drop radius, r (Fig. 4.1):
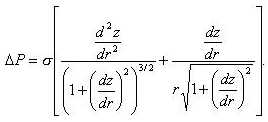 (4.1)
(4.1)The drop profile, z(r), may be solved for numerically with knowledge of DP(r,z) and the interfacial tension, s, which is a constant for all practical purposes in this model. The effect of gravity on DP may be ignored for colloidal AFM of most oil-water interfaces (n-hexadecane-water: Dr = 0.224g/cm3, s = 52 mN/m, b ~ 0.3 mm) since the Bond number is small (Bo < 0.01):
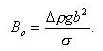 (4.2)
(4.2)Then, the only consideration in DP is the internal pressure of the drop, Po, and the surface pressure, P(z(r)):
![]() (4.3)
(4.3)
The surface pressure term is more properly known as a function of interfacial separation, D(z(r)). This discussion will be limited to DLVO forces alone, and sometimes only the electrostatic double-layer interaction is necessary.
The most significant difference from the drop-plate case is the reduced critical separation. When the microsphere that serves as the AFM probe deforms a droplet via repulsive forces, the local interfacial curvature can now invert, becoming negative, then continue to decrease in magnitude until the local drop radius is equal and opposite the sphere radius. This is equivalent to parallel plates or zero local net curvature with respect to the Derjaguin approximation relating parallel plate interactions to the sphere-plate case. Here, the limiting separation can be as much as an order of magnitude smaller than for the drop-plate. This theoretical minimum separation may be of lesser experimental consequence where the sphere roughness is of the same magnitude or larger. If surface roughness is considered, the calculated critical separation actually corresponds to some type of averaged experimental separation and the interfaces will contact sooner than predicted. In any event, the fluid interface cannot deform indefinitely as the simplified theory holds due to physical constraints. At some force, the conditions for stability fail and the droplet will wet the sphere. Previous calculations of the interfacial profile for the drop-plate interaction hold the internal drop pressure constant, which may not be the case for the AFM scenario.
Experimental
The modified Young-Laplace Equation (Eq. 4.1) is numerically solved for the drop profile as a function of the equilibrium surface pressure applied by an impinging sphere at some distance, Do, from the interface. An iterative spreadsheet solver and a 4th-order Runge-Kutta procedure with adaptive step-size are both implemented for best solution times to yield the detailed profile within the interaction regime and the total linear drop deformation at the apex.
Force profiles between a 17-mm diameter polystyrene sphere (Duke Scientific Corp., Palo Alto, CA) and n-hexadecane in water is used to compare with computational results and as an empirical aid for developing relations for deformation with applied force. The same AFM (AutoProbe CP, PSI) and cantilever type (kc ~ 0.05 N/m) are used with a custom-built glass liquid cell replacing the commercial vinyl cell (PSI). The clear liquid cell is necessary to view the formation of the drop and to monitor AFM probe alignment and approach. The Teflon tube of the old cell design is replaced by a flat, smooth sheet of Mylar onto which a hemispherical drop of oil is attached under water with a microsyringe and Ramé-Hart goniometer. An oil hemisphere within the range of 200-350 mm in radius is placed on the Mylar with ~90° contact angle. Varying the needle orifice controls the range of drop size. The experimental data along with a fundamental, interfacial force balance gives rise to a simple, closed-form solution for interfacial deflection.
Results and Discussion
Iterative solutions to Eq. 4.1 only seems to be are
accurate for the profile that lies relatively near the impinging sphere,
perhaps a few percent of the drop radius. This is due to error propagation
for larger r values if the step size is made sufficiently small.
The limit in the iterative solution is in the estimate of interfacial slope
which requires increased computational time for increased accuracy.
Thus, a 4th order Runge-Kutta procedure for solving the Young-Laplace
Equation was implemented to calculate the total drop height deformation
as a linear quantity in the z direction, i.e. the height difference from
the drop apex (r = 0, z = 0) to the fixed radius of the drop, Rd,
compared to the undeformed drop height, which is also Rd.
This assumes an initially hemispherical drop or, similarly, a 90° contact
angle that is basically true to the experimental design. The true
contact angle will not change appreciable, only a fraction of a degree.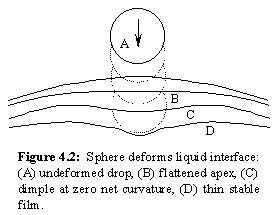
For the rigid sphere-droplet interaction, there appear to be two deformation regimes experimentally observed which can be explained as the sum of two ideal relations, though they may prove to be coupled in the strictest sense. First, for sufficiently weak forces the liquid interface deflects linear. This weak regime is characterized by positive local curvature for the drop (Fig. 4.2A-B) and every point of the sphere is above the drop. The drop can resist interaction with the sphere through internal drop pressure and surface tension. From the drop-plate calculations of Miklavcic et al., it can be seen that the deformation dependence on separation is the same as that for the force for small values1. Therefore, the deformation varies linearly with applied force, perhaps even exactly for weak interactions!
The sphere-drop experiments deviate from linear deflections when the interaction becomes stronger, that is, when the local interfacial curvature begins to conform to the sphere (Fig. 4.2C). The surface becomes dimpled (C & later D, negative curvature) and the sphere apex eventually breaks below the plane of maximum drop height, though for very strong, long-range repulsion it may not do so until the dimple is quite pronounced. It is uncertain whether the onset of the nonlinearity is at the reversal of interfacial curvature (B, onset of dimpling), at the critical separation as defined previously (C, zero local net curvature), or at some other separation in this vicinity. The extremely small forces involved and the necessity of fitting parameters to model the experiment leave uncertainty at this point, though it may be possible to discover with numerical computations below. A semi-empirical approach to the problem attempts to correlate deformation with applied force through two overlapping regimes.
Drop Profile Calculations for Impinging Rigid Sphere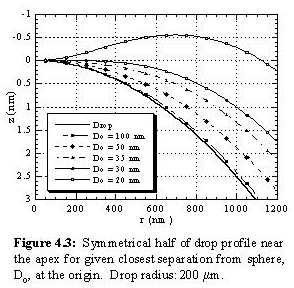
Results from the numerical solution of Eq. 4.1 for
drop profiles at different sphere-plate separations, Do, are plotted together
in Fig. 4.3. All profiles are shown with the drop apexlater, the
bottom of the dimpleas the origin in order to view the detail within the
interaction zone. The graph shows a symmetric half of the cap of
an oil droplet (Rd = 200 mm) deforming
due to a repulsive DLVO interaction with a spherical, polystyrene probe
(Rs = 8.5 mm). Constant surface
charge density boundary conditions are applied for both interfaces with
isolated surface potentials estimated at 18 mV in 10-4 M NaNO3.
Details of the surface pressure calculations are given elsewhere.
The curve in Fig. 4.3 for Do = 100 nm just begins to distinguish itself from the undisturbed drop profile. At a separation of 30 nm the local curvature has inverted at the apex of the droplet and the dimple begins to form with increasing applied pressure. Most of the curvature variation resides near the apex of the drop, the most visually interesting region. Conversely, the majority of the deformation of the interface in a linear sense occurs over the entire drop. This becomes evident by comparing results from several reference points along the curve z(r) from which to reckon Dz for a given DDo. An accurate calculation of drop deformation may only be made when the reference point is the location of the three-phase line for the pinned drop, or the opposing apex for the free drop.
 The formation of the dimple is what allows the sphere-drop geometry to
acquire smaller separations for repulsive systems than the analogous drop-plate
design. Instead of being limited by the internal drop pressure, it
is limited by the curvature attainable within the compliant region.
A smaller probing sphere would create a smaller dimple, thus having higher
Laplace pressure, ks, within that region to
resist the surface forces. Since the sphere radius is much smaller
than the initial drop radius, the Laplace pressure quickly dominates the
internal drop pressure, Po, once the interfacial curvature inverts,
i.e. dimpling for P(z(0)) > Po.
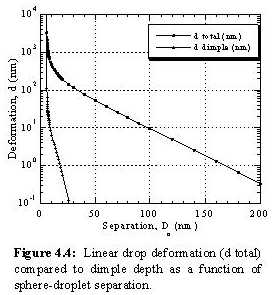
Comparing dimple depth (peak-to-valley) with the total droplet deformation
for the same conditions as above (Fig. 4.3), it would seem that there is
a connection between the appearance of the dimple and the deviation from
the exponential behavior of interfacial deflection with separation (Fig.
4.4). It is unclear what, if any, fundamental conclusion might be
drawn from this, since the drop-plate geometry exhibits a similar deviation
without interfacial inversion.
The formation of the dimple is what allows the sphere-drop geometry to
acquire smaller separations for repulsive systems than the analogous drop-plate
design. Instead of being limited by the internal drop pressure, it
is limited by the curvature attainable within the compliant region.
A smaller probing sphere would create a smaller dimple, thus having higher
Laplace pressure, ks, within that region to
resist the surface forces. Since the sphere radius is much smaller
than the initial drop radius, the Laplace pressure quickly dominates the
internal drop pressure, Po, once the interfacial curvature inverts,
i.e. dimpling for P(z(0)) > Po.
Comparing dimple depth (peak-to-valley) with the total droplet deformation
for the same conditions as above (Fig. 4.3), it would seem that there is
a connection between the appearance of the dimple and the deviation from
the exponential behavior of interfacial deflection with separation (Fig.
4.4). It is unclear what, if any, fundamental conclusion might be
drawn from this, since the drop-plate geometry exhibits a similar deviation
without interfacial inversion.
The droplet deformation is a linear function of the
applied force for the weak overlap regime of the double-layer interaction
at large separations, similar to the drop-plate results1, but
only as long as the surface pressure is sufficiently smaller than Po.
The magnitude of the dimple contribution to the total deformation is small
(Fig. 4.4), but the effect of Po, determined by the initial
drop radius, Rd, is evident over a much broader separation range
with significant impact on the sensitivity of AFM experimental analysis.
Interfacial inversion begins at a larger separation for larger Rd;
but the change in total drop deflection, d, with Rd is relatively
small. In order to see the trend clearly, curves representing d vs.
Do for a number of Rd values were subtracted from
a reference curve for Rd= 0.1 mm for plotting Dd,
giving a more appropriate scale (Fig. 4.5).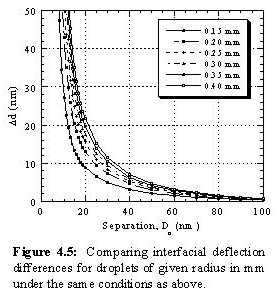
While the magnitudes of Dd are small compared to those of d, they may not be ignored. The effective linear stiffness of a droplet as measured in an AFM force vs. distance study increases with decreasing drop size, as expected. Another way of stating this result is that a larger drop deforms more for the same applied load than a smaller one. The stiffness for a 325 mm n-hexadecane droplet in water was 0.0072 N/m as measured by a polystyrene sphere (Rd = 8.5 mm) in the range of applied loads of 1-2.5 nN (since the stiffness is not truly linear), compared to 0.0087 N/m for a 200 mm droplet. The numbers remained somewhat ambiguous until the relation between measured force and surface pressure is developed.
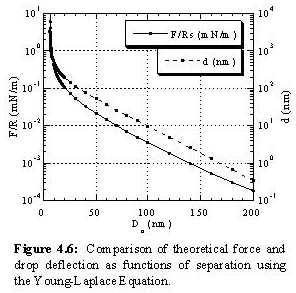 For a given separation, the surface force is calculated (Fig. 4.6), correcting
for the change in the effective system radius of curvature, Reff,
which may be used with Derjaquins approximation (Eq. 1.1) to get the equivalent
sphere-plate interaction from the energy relation for parallel plates.
As previously, both surface potentials are assumed to be 18 mV in 10-4
M NaNO3. The computed force is an estimate of that which
is measured directly by the AFM, and it is conventionally scaled by the
radius of the sphere, Rs, rather than by Reff which approaches
infinity faster than F for decreasing separation. Drop deformation,
d, is also plotted, showing an almost identical decay constant at large
Do, which is, for all intents and purposes, the Debye length,
k-1.
However, the forms of F/R and d differ by more than a factor for small
separations. There is no obvious, simple relation visible from a
plot of F/R vs. d. Figure 4.7 suggests that an exponential relation
for large deflections may be a suitable approximation, but this is not
sufficient for the purpose of fitting AFM data.
For a given separation, the surface force is calculated (Fig. 4.6), correcting
for the change in the effective system radius of curvature, Reff,
which may be used with Derjaquins approximation (Eq. 1.1) to get the equivalent
sphere-plate interaction from the energy relation for parallel plates.
As previously, both surface potentials are assumed to be 18 mV in 10-4
M NaNO3. The computed force is an estimate of that which
is measured directly by the AFM, and it is conventionally scaled by the
radius of the sphere, Rs, rather than by Reff which approaches
infinity faster than F for decreasing separation. Drop deformation,
d, is also plotted, showing an almost identical decay constant at large
Do, which is, for all intents and purposes, the Debye length,
k-1.
However, the forms of F/R and d differ by more than a factor for small
separations. There is no obvious, simple relation visible from a
plot of F/R vs. d. Figure 4.7 suggests that an exponential relation
for large deflections may be a suitable approximation, but this is not
sufficient for the purpose of fitting AFM data.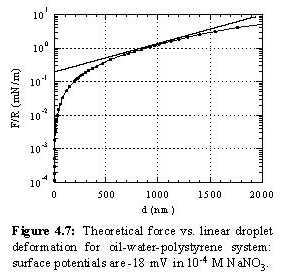
While solving for the exact drop profile for a given applied load is elegant and comprehensive, this may only be accomplished through extensive numerical calculations for each absolute separation value to construct a force-separation profile from AFM force-distance data. The process of fitting parameters is not only arduous but also inefficient and, consequently, less accurate. It is certainly more desirable to have closed-form equations that may be applied directly and in short order with good approximation to fit experimental data. The following section develops approximate semi-empirical correlations for drop deformation with force in an attempt to deconvolute raw data for direct comparison to theoretical surface forces.
Oil-in-Water AFM Experiments and Deformation Correlations
It would be convenient to find a distance-correcting
function so that the painstaking computations of the Young-Laplace procedure
are not required each time a force profile is constructed from AFM data.
A number of experiments were conducted using different spheres and different
oil drops that varied in radius. Since the drop radius cannot be
well controlled at this scale, the effect of changing internal drop pressure
complicates the interpretation of results. The smaller drops are
clearly stiffer than the larger drops, but a quantitatively meaningful
comparison depends on understanding the interfacial deformation.
Attempts to fit the data to DLVO theory with a power law were met with
varied success; drop deflection scaled as force raised to a power between
0.5 and 1. The dependence is probably less than one for strong interactions
since Fig. 4.8 and many others like it essentially prove that the relationship
is not linear. However, a linear correction for forces less than
0.1-0.2 mN/m is arguably valid (Figs. 4.6 and 4.8).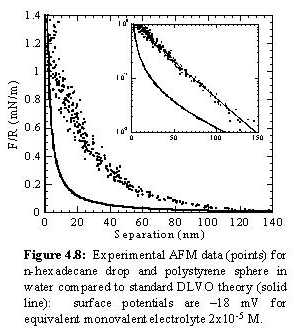
Simply treating the oil-water interface as a deflecting Hookian spring is insufficient for producing a reasonable force-separation profile from AFM data. Taking one example curve (Fig. 4.8), it is apparent that a linear slope correction suggests a much longer-range force than can be explained by electrostatic repulsion. The expected DLVO curve for polystyrene-oil (n-hexadecane) interactions in water acting as constant charge density surfaces is shown as the solid line, using an isolated surface potential of 18 mV for both polystyrene and oil in 2x10⁻⁵ M monovalent electrolytethe equivalent value implied from the conductivity of distilled water, an estimated Hamaker constant for hydrocarbons of 5x10-21 J, and a system spring constant ks = 0.00855 N/m. The anchored oil droplet has radius of curvature of ~200 mm.
It is probable that the oil-water interface exhibits some charge regulation making this an overestimate of the interaction magnitude, especially at smaller separations. Since there is no reason to believe that any other repulsive interaction is present to cause this kind of response, the most likely conclusion is that the interfacial deflection is more complex than the linear assumption. (Hydrodynamic interactions are orders of magnitude smaller for the approach velocity used.) The separation scale was determined by subtracting the linear cantilever and interface deflections from the total AFM scanner displacement. The value of ks was determined from the slope of the constant compliance portion of the force vs. displacement, that portion of the data above 1 mN/m. The sum of cantilever and interface deflections was calculated as the force divided by the system spring constant, F/ks. An exponential decay is apparent from the inset of Fig. 4.8, but curve fitting gives a decay length of 30 nm which is equivalent to a monovalent electrolyte concentration of ~10-4 M. This discrepancy is not critical since it is clear that the interface was not properly modeled. It is also extremely difficult to maintain a concentration below 10-4 M when using the glass liquid cell, which leaches salts into the solution.
 Linear drop deformation for weak interactions is not only accepted by other
researchers but has a basis of proof from both the present AFM experiments
(sphere-drop) and theoretical calculations (drop-plate) for the case of
positive interfacial curvature. But the reason for a weaker deflection
dependence on force for stronger interactions is not clear at a glance,
though a connection with the onset of dimpling is suspected. First,
it is important to remember that the same applied force causes the local
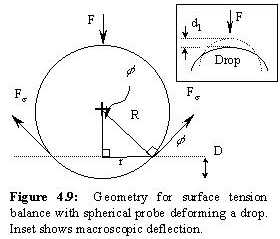
dimpling and the global drop flattening. A force balance about either
the thin film or the wetted perimeter provides the relation for dimple
depth. The force applied by the AFM is balanced by the surface pressure
between sphere and droplet (Fig. 4.9), but this surface pressure can be
expressed as an equivalent resultant line force, i.e. surface tension s,
acting on some perimeter, 2pr, at an angle f
from horizontal:
Linear drop deformation for weak interactions is not only accepted by other
researchers but has a basis of proof from both the present AFM experiments
(sphere-drop) and theoretical calculations (drop-plate) for the case of
positive interfacial curvature. But the reason for a weaker deflection
dependence on force for stronger interactions is not clear at a glance,
though a connection with the onset of dimpling is suspected. First,
it is important to remember that the same applied force causes the local
dimpling and the global drop flattening. A force balance about either
the thin film or the wetted perimeter provides the relation for dimple
depth. The force applied by the AFM is balanced by the surface pressure
between sphere and droplet (Fig. 4.9), but this surface pressure can be
expressed as an equivalent resultant line force, i.e. surface tension s,
acting on some perimeter, 2pr, at an angle f
from horizontal:
![]() (4.4)
(4.4)
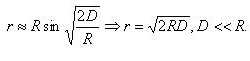
The interfacial angle f can be written in physical dimensions of the sphere for the radius of the perimeter, r, just as the AFM contact angle measurement by Preuss and Butt, but holds geometrically true whether wetting or non-wettingwhen f is not related to the contact angle:
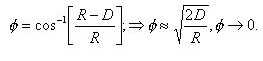 (4.5)
(4.5)
The AFM system of micron-sized probe against a much larger sphere always gives a small angle for the non-wetting cases, and after wetting we no longer have any separation to consider surface forces across. It is this latter case when f is related to the contact angle (q = f at F = 0) that the approximation will not apply for all cases. The contact angle is directly calculated from the snap-in distance, which will be the same as D in this instance.
For a non-wetted condition, the resultant tension force acts on an effective perimeter concentric with a closed loop on the sphere itself approximated by the following:
 (4.6)
(4.6)![]() (4.7)
(4.7)
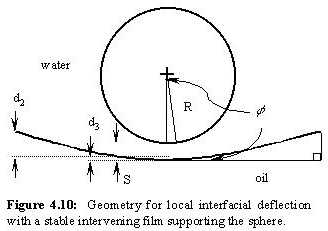 Calculations
of sphere-drop separation are complicated for AFM because of the dimpling
consideration. Whether depression of the drop occurs with a stable
film (Fig. 4.10) or with a wetted perimeter, the relationship for force
and dimple depth remains valid (Eq. 4.7). If a stable film persists,
there is also a less significant linear contribution (d3 ~ F/k3)
to interfacial depression corresponding to that section of interface moving
in strictly constant compliance with the spherical capessentially the
area of constant interaction. Within this region, the net system
curvature is zero and the area increases linearly with the cap height,
d3. This added deflection is essentially lumped into the
global deflection, d1, (Fig. 4.9) with a system higher stiffness
than k from the weak deflection regime, even though d3 it is
a local depression effect. This, in turn, simplifies the fit by limiting
the parameter set to maintain a suitably defined problem: one parameter,
k, for the weak interaction regime, and two parameters, k1 and
k2, for the strong interaction regime:
Calculations
of sphere-drop separation are complicated for AFM because of the dimpling
consideration. Whether depression of the drop occurs with a stable
film (Fig. 4.10) or with a wetted perimeter, the relationship for force
and dimple depth remains valid (Eq. 4.7). If a stable film persists,
there is also a less significant linear contribution (d3 ~ F/k3)
to interfacial depression corresponding to that section of interface moving
in strictly constant compliance with the spherical capessentially the
area of constant interaction. Within this region, the net system
curvature is zero and the area increases linearly with the cap height,
d3. This added deflection is essentially lumped into the
global deflection, d1, (Fig. 4.9) with a system higher stiffness
than k from the weak deflection regime, even though d3 it is
a local depression effect. This, in turn, simplifies the fit by limiting
the parameter set to maintain a suitably defined problem: one parameter,
k, for the weak interaction regime, and two parameters, k1 and
k2, for the strong interaction regime:
 (4.8)
(4.8)
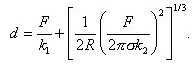 (4.9)
(4.9)
With the current semi-empirical deflection model as described above, the new procedure for distance correction becomes more accurate but only slightly more complex. The linear correction, k, for weak interactions is determined by matching experimental and theoretical decay lengths at long-range. The interfacial deflection, d, is subtracted from the total displacement (Eq. 4.8). The uncertainty in this procedure greatly increases with decreasing decay length. The strong interaction regime (Eq. 4.9) is then additionally corrected by the dimpling deflection term (rearranging Eq. 4.7), adjusting k2 as needed. Fitting the strong regime begins with k1 = k until k2 is optimal, at which point a slight increase in k1 may provide a better overall fit after subsequent adjustment of k2. This suggests that the global deflection of the interface is altered because of the local deformation, meaning that they are not truly independent functions. Equation 4.9 is applied for forces above ~0.1 mN/m, which is consistent with the theoretical prediction of interfacial curvature inversion (compare Figs. 4.3, 4.4, and 4.6).
The above arguments for the semi-empirical correlations
are strengthened by their agreement with the predictions from the Young-Laplace
Equation (Eq. 4.1). Taking the values for F/R vs. d plotted in Fig.
4.6 from the numerical solution of Eq. 4.1, a direct comparison can be
made with the form of Eq. 4.7 (Fig. 4.11). The data is fitted with
a power law of exponent 1.52 (~3/2, as previously found) for the applicable
range of force measured in AFM experiments. Recognizing that the
derived correlation of Eq. 4.7 is an approximation, the agreement is quite
good and may be improved with a small linear correction, as in Eq. 4.9.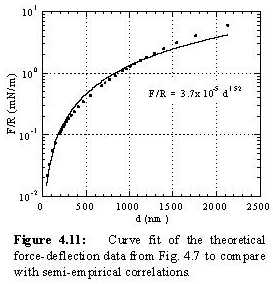
The previous force profiles for polystyrene against n-hexadecane in water (Fig. 4.8) has been replotted to give the best fit to DLVO forces (Fig. 4.12). The dots represent raw data corrected for interfacial deflection using both weak and strong regime correlations (Eqs. 4.8 and 4.9) to plot an estimate of true sphere-drop separation. This is in excellent agreement with DLVO theory (solid thin line) using isolated surface potentials of -20 mV for both constant charge density surfaces in 4x10⁻⁵ M equivalent monovalent salt: Hamaker constant, A = 5x10-21 J, k1 = 0.00935 N/m, k2 = 0.0033 nm-1. Expected values of k1 and k2 from curve fitting the plot in Fig. 4.11 in the appropriate regions of comparison are 0.006 N/m and 0.00023 nm-1, respectively. Clearly underestimating the empirical findings, the linear spring constant, k1, is closer to those found experimentally using Eq. 4.8 alone for small forces. The discrepancy of k2 magnitude likely suggests an incorrect boundary condition at the three-phase line (TPL). If the TPL is not fixed but advances along the substrate with increasing displacement, the effect would be a much larger experimental value for k2. This means that the interface does not have to deform as much locally because the entire drop is essentially moving out of the way. Because of the ratio of deflection to drop radius, the TPL can alter configuration an infinitesimal amount for a measurable effect at the apex due to the impinging sphere.
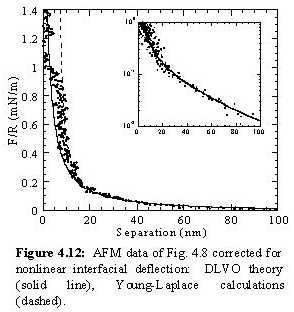 The data of Fig. 4.12 deviates from the theoretical model around 1 mN/m
when the sphere is wetted and is pulled into the oila relatively slow
engulfment. This is complimented by the appearance of a large pull-off
force (not shown). The data above ~1 mN/m should not be compared
with surface forces vs. separation but with interfacial tension forces
vs. apparent wetted perimeter. In this way, it is possible to conduct
microtensiometry6-8,14.
The data of Fig. 4.12 deviates from the theoretical model around 1 mN/m
when the sphere is wetted and is pulled into the oila relatively slow
engulfment. This is complimented by the appearance of a large pull-off
force (not shown). The data above ~1 mN/m should not be compared
with surface forces vs. separation but with interfacial tension forces
vs. apparent wetted perimeter. In this way, it is possible to conduct
microtensiometry6-8,14.
No hydrophobic interaction is apparent in this case, though more data should be analyzed before any conclusion can be drawn. It is possible that a carefully detailed electrolyte titration will reveal a small hydrophobic interaction that is lost in the data manipulation due to the number of unspecified parameters. A hydrophobic force may be justifiably invoked to account for the deviations from expected DLVO forces, but this is a somewhat naive approach for a single curve since some parameters are not yet well-constrained and might result in a so-called phantom interaction. This is an untenable situation for the AFM liquid interface study since the deforming oil droplet is an additional unknown compared to conventional solid-solid interactions.
Conclusions
The deformation of a fluid-fluid interface in the form of a drop is linear over weak interaction ranges, when the interface acts like a Hookian spring whose stiffness is a constant, k (N/m). Forces strong enough to significantly change the local interfacial curvature of the interface cause nonlinear deformation. When the surface is dimpled inward by repulsive forces, the total deformation, d, continues as described by the sum of two terms (d = d1 + d2) which have been described empirically (Eqs. 4.8 and 4.9): d1 ~ F/ k1 for global deflection and d2 ~ (F/k2)2/3 for local deflections. This is analogous to the theory of solid surface elasticity though different in phenomenon and form. Even the more ideal elastic theory of solids requires a third correction factor beyond the global and local terms for precise calculations, so these two semi-empirical relations for the interfacial deflection of a drop by a rigid sphere is not daunting.
Until the exclusive use of the semi-empirical relationships for drop deflection is justified by sufficient experiments, the need to numerically solve the Young-Laplace Equation (Eq. 4.1) for AFM data analysis remains. The next chapter examines the oil-water interface via an electrolyte titration, described elsewhere, to probe for the hydrophobic effect and to further investigate the behavior of the deforming interface. While the developed correlations are expected to hold true, their usefulness will likely be limited by the higher concentrations of salt employed because there will be fewer data in the weak interaction regime to determine parameters for Eqs. 4.8 and 4.9.
References
1. Miklavcic, S.J., Horn, R.G., Bachmann, D.J. J. Phys.
Chem. 1995, 99, 16357.
2. Fielden, M.L., Hayes, R.A., Ralston, J. Langmuir 1996,
12, 3721.
3. Mulvaney, P., Perera, J.M., Biggs, S., Grieser, F.,
Stevens, G.W. J. Colloid Interface Sci. 1996, 183, 614.
4. Snyder, B.A., Aston, D.E., Berg, J.C. Langmuir 1997,
13, 590.
5. Aston, D.E., Berg, J.C. J. Pulp Paper Sci. 1998, 24,
121.
6. Preuss, M., Butt, H.-J. Langmuir 1998, 14, 3164.
7. Preuss, M., Butt, H.J. J Colloid Interface Sci 1998,
208, 468.
8. Preuss, M., Butt, H.-J. Int. J. Miner. Process. 1999,
56, 99.
9. Basu, S., Sharma, M.M. J. Colloid Interface Sci. 1996,
181, 443.
10. Hartley, P.G. et al. Langmuir 1999, 15, 7282.
11. Horn, R.G. et al. J. Phys. Condens. Matter 1996, 8, 9483.
12. Bachmann, D.J., Miklavcic, S.J. Langmuir 1996, 12, 4197.
13. Miklavcic, S.J. Phys. Rev. E 1996, 54, 6551.
14. Ecke, S., Preuss, M., Butt, H.J. J Adhesion Sci Technol 1999,
13, 1181.