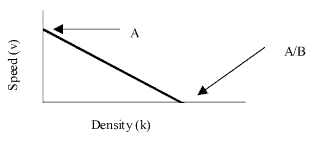
 Greenshield was able to develop a model of uninterrupted traffic flow that predicts and explains the trends that are observed in real traffic flows. While Greenshield’s model is not perfect, it is fairly accurate and relatively simple. Greenshield made the assumption that, under uninterrupted flow conditions, speed and density are linearly related. This relationship is expressed mathematically and graphically below. See figure 1.0. v=A-B*k Where: As noted above, you can determine the values of the constants A and B through field observations. This is normally done by collecting velocity and density data in the field, plotting the data, and then using linear regression to fit a line through the data points. The constant A represents the free flow speed, while A/B represents the jam density. Figure 1.0: Speed vs. Density
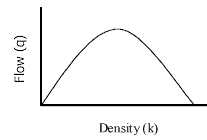
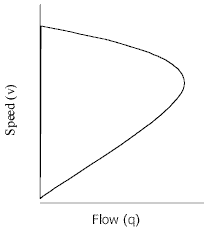
Inserting Greenshield’s speed-density relationship into the general speed-flow-density relationship yields the following equations: q = (A-B*k)*k or q = A*k – B*k2 Figure 2.0: Flow vs. Density This new relationship between flow and density provides an avenue for finding the density at which the flow is maximized. dq/dk = A – 2*B*k Therefore, at the density given above, the flow will be maximized. Substituting this maximized value of k into the original speed-density relationship yields the speed at which the flow is maximized. v = A – B*(A/(2*B)) or v = A/2 This indicates that the maximum flow occurs when traffic is flowing at half of free-flow speed (A). Substituting the optimum speed and density into the speed-flow-density relationship yields the maximum flow. q = (A/2)*(A/(2*B)) or q = A2/(4*B) Figure 3.0 shows the relationship between flow and speed graphically. Figure 3.0: Flow vs. Speed
As the density increases the flow increases to some maximum value, but a continual increase in density will cause the flow to decrease until jam density and zero flow conditions are reached.
|